EUR/USD
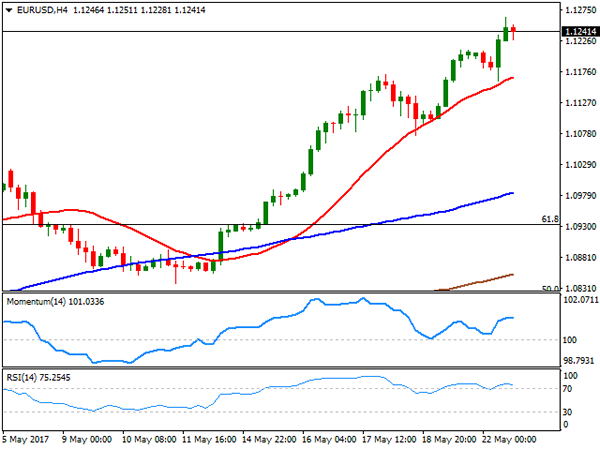
The EUR/USD pair keeps rallying to fresh 2017, pretty much daily basis, trading this Monday as high as 1.1263, before settling around 1.1240. The absence of macroeconomic data in the EU maintained the pair ranging early London, but buyers seize their chances after comments from German’s Chancellor Angela Merkel hit the wires, blaming the ECB on EUR’s weakness, when referring to the country’s trade surplus. The headline was enough to bring buyers back. There were no relevant news in the US either, with a couple of Fed’s member speaking in different events that had nothing to do with economic policies, with only Kaplan referring to rates, reiterating the usual stance that three rate hikes are appropriated. This Tuesday, focus will be on May´s preliminary Markit PMIs, for the EU and the US, whilst this last will also release New Home Sales and the Richmond manufacturing index.
Technically, the bullish tone persists, although due to the limited intraday range and the late retracement in the US afternoon, indicators in the 4 hours chart have lost upward strength, although the RSI remains within overbought territory. In the same chart and early decline was reverted on an approach to a bullish 20 SMA, currently providing support at 1.1165. Beyond the daily high, the pair has room to extend its advance up to 1.1300, where it topped early November as an immediate reaction to US election, while further gains will likely see the pair reaching the 1.1340 region this Tuesday. A deeper correction could take place on a break below 1.1160, with scope then to revisit the 1.1080 region.
Support levels: 1.1200 1.1160 1.1120
Resistance levels: 1.1260 1.1300 1.1340
USD/JPY
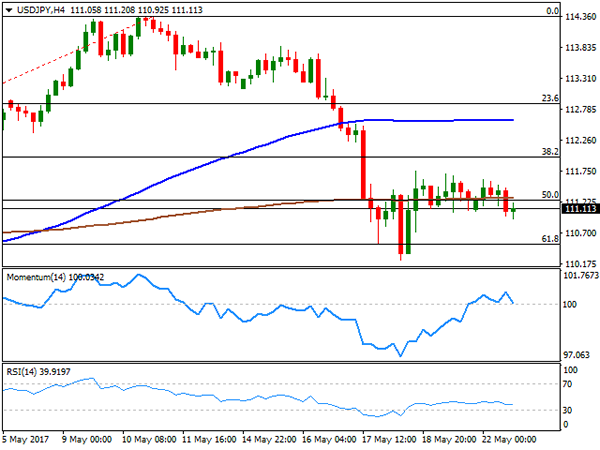
The USD/JPY pair advanced modestly at the beginning of the day, following the release of Japanese trade balance figures, which missed expectations but anyway showed economic progress in the country. Exports were up in April by 7.5%, missing expectations of 7.8%, while imports rose by 15.1%, surpassing market’s estimates of 14.8%. The final surplus in the mentioned month, shrank to ¥481.7B. The early advance was contained by selling interest around 111.60, with the pair later trapped between the positive tone of equities and dollar’s weakness, falling down to 110.92, but regaining the 111.00 level ahead of the close. During the upcoming Asian session, the country will release the final revisions of March leading indexes, alongside with the May preliminary Markit PMI, expected at 52.9 from a previously revised 52.7. The pair settled a couple of pips below a key static resistance, the 111.20 region where in the 4 hours chart, the 200 SMA converges with the 50% retracement of the latest bullish run. In the same chart, the Momentum indicator has turned south around its 100 level, while the RSI indicator consolidates around 40, all of which supports additional declines on another downward acceleration below the 111.00 figure.
Support levels: 111.00 110.50 109.90
Resistance levels: 111.60 112.00 112.45
GBP/USD
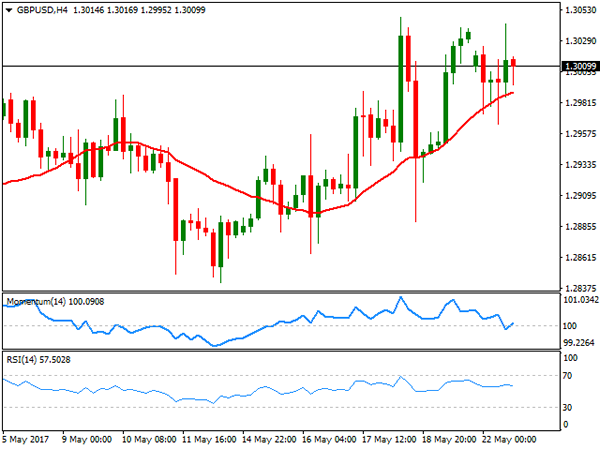
The Pound started the week with a negative footing, but persistent dollar’s weakness helped the GBP/USD pair to regain the 1.3000 level, in spite of Brexit turmoil. The pair gapped lower at the opening, undermined by Brexit’s minister Davis, who said that the UK can leave the negotiation’s table should the EU insist on the payment of a Brexit bill of around €100 billion. The pair fell to 1.2965 before stabilizing, regaining the upside ahead of Wall Street’s opening as the market resumed dollar’s selling. The issue, however, remains as a Damocles’ sword pending above Pound, as EU’s chief Brexit negotiator, Michel Barnier, reiterated this Monday that there won’t be any trading arrangement discussion until the accounts are settled. From a technical point of view, the pair holds a neutral stance, with the price barely above its 20 SMA, and the Momentum indicator heading nowhere around its mid-line, while the RSI also consolidates but around 56. The pair will likely retain the neutral stance ahead of the UK election, with a limited downward scope on persistent dollar’s weakness.
Support levels: 1.2995 1.2960 1.2920
Resistance levels: 1.3060 1.3100 1.3135
GOLD
Gold prices regained the upside this Monday, with spot settling at $1,260.15 a troy ounce, its highest settlement in almost three weeks. Speculative interest continued dumping USD-related assets, favoring an advance in the safe-haven commodity, despite improved market sentiment. The dollar index fell to a fresh 2017 low of 96.65, reaching levels last seen in November and barely bouncing at the end of the day. Gold managed to shrug off Fed’s rate hikes rhetoric, as Kaplan hit the wires by saying that three hikes remain appropriated. From a technical point of view, the daily chart shows that the index advanced above still directionless moving averages, although held below last week’s peak of 1,264.95, while technical indicators have partially lost their upward strength, but remain well above their mid-lines. In the 4 hours chart, technical readings point to further gains, with the price now above its moving averages, and technical indicators heading north within positive territory.
Support levels: 1,251.45 1,245.40 1,237.40
Resistance levels: 1,264.95 1,273.10 1,282.40
WTI CRUDE OIL
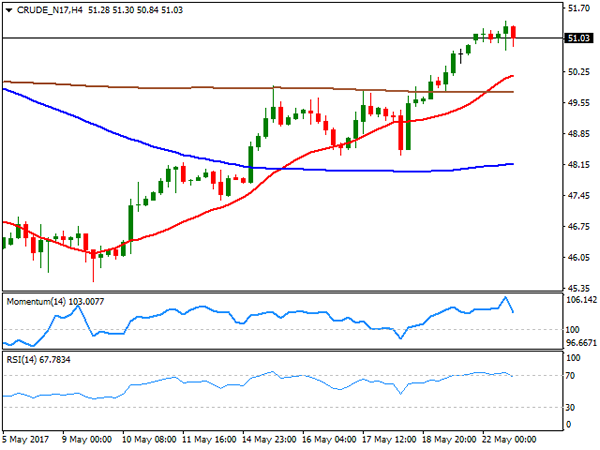
Crude oil prices ended the day pretty much unchanged, with West Texas Intermediate futures settling at $51.02 a barrel after peaking at a fresh 5-week high of 51.41. Ahead of the OPEC Vienna summit to take place this week, market has already priced in an extension on the output cut deal, although for how long remains as the big question. Saudi Arabia and Iraq together back a nine-month extension, but news hit the wires earlier today that Iraq and Kuwait will be more comfortable with just a six-month extension. The black gold maintains the positive tone from a technical perspective, with the commodity ending the day right above its 100 DMA for the first time in over a month, while technical indicators have barely eased but remain near overbought levels. Shorter term, the 4 hours chart shows that technical indicators have corrected overbought readings before turning flat within positive territory, whilst the price remains well above its moving averages, suggesting that the risk remains towards the upside, despite the absence of upward momentum.
Support levels: 50.45 49.80 49.30
Resistance levels: 51.40 51.90 52.60
DJIA
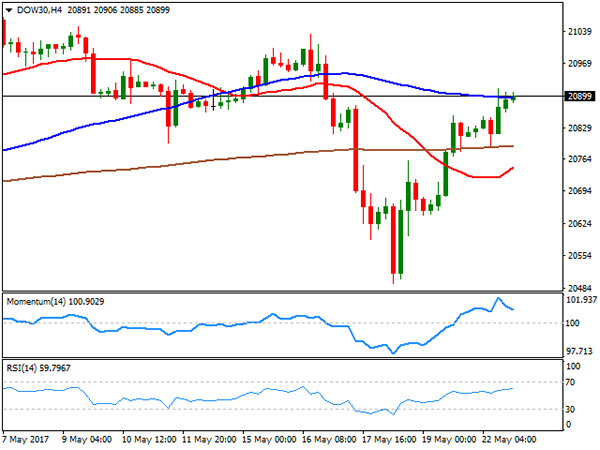
Wall Street extended its rally this Monday, with the Dow Jones Industrial Average adding 90 points to end at 20,894.83, fully erasing last week’s losses. The Nasdaq Composite added 59 points to 6,133.62, while the S&P settled at 2,394.02, up 0.52%. Almost all sectors advanced, with the energy one being a clear exception. Within the Dow, Boeing led advancers with a 1.55% gain, followed by Cisco Systems that added 1.38$. Pfizer was the worst performer, down 0.99%, followed by El du Pont that shed 0.57% and Chevron which lost 0.38%. DJIA’s recovery was not enough to put it back in the bullish track, according to the daily chart, as the index stalled its recovery right below a modestly bearish 20 DMA, whilst the Momentum indicator turned flat below its 100 level, and the RSI indicator lost upward strength, now consolidating around 53. Shorter term, the 4 hours chart shows that the index held once again above the 20 and 200 SMAs, now struggling around a horizontal 100 SMA, while the RSI indicator heads north around 59 and the Momentum indicator retreats within positive territory.
Support levels: 20,770 20,718 20,641
Resistance levels: 20,857 20,905 20,960
FTSE100
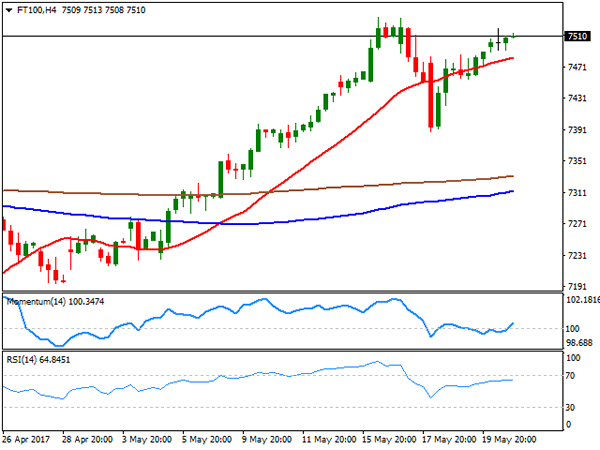
The Footsie managed to add 25 points or 0.34% and close the day at 7,496.34, helped by the soft tone of the British Pound. Also, backing UK´s shares were the latest polls ahead of the election, which clearly show that Theresa May’s Conservative Party is the favorite. Marks& Spencer led the way higher by rising 2.75% ahead of on Wednesday, and followed by Burberry Group that added 2.45%. Hikma Pharmaceuticals was the worst performer, ending the day down 4.61%. Commodity-related shares closed mixed, with Rio Tinto up 1.37% and Anglo American ending the day down 0.69%. Up for a second consecutive day, the index holds near record highs, and still bullish according to technical readings in the daily chart, as its also standing far above its moving averages, whilst the RSI indicator heads north around 66, as the Momentum consolidates near overbought levels. In the 4 hours chart, the upside is also favored, despite technical indicators lack directional strength within positive territory, as declines towards a bullish 20 SMA continue to attract buying interest.
Support levels: 7,495 7,462 7,435
Resistance levels: 7,534 7,570 7,605
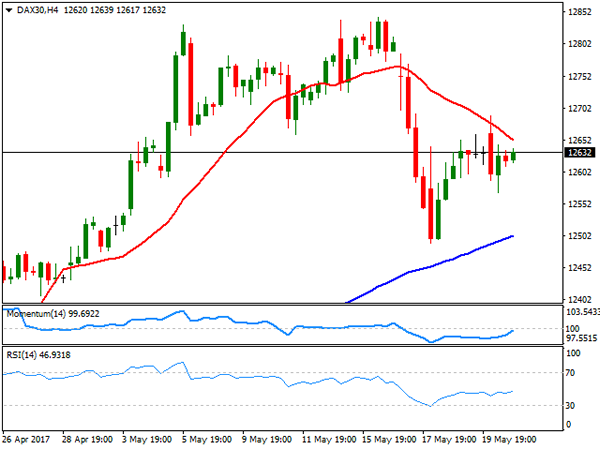
DAX
European equities closed generally lower this Monday, reverting early gains after German Chancellor Merkel said that the common currency is ‘too weak,’ prompting a rally in the EUR against all of its major rivals. The German DAX ended at 12,619.46, down by 19 points or 0.15%, with RWE AG, a supplier of electricity and natural gas, leading advancers with a 3.11% gain. The worst performer was Merck, down 1.17%, while banks closed pretty much unchanged, with Deutsche Bank down 0.30% and Commerzbank adding 0.07%. The daily chart for the index shows that it held once again a few points above a bullish 20 DMA, while technical indicators have lost their upward strength, and turned modestly lower within neutral territory, indicating an increasing risk of an upcoming downward move. In the 4 hours chart, the index remains below a bearish 20 SMA, while technical indicators aim modestly higher within negative territory, hardly enough to support an upward move.
Support levels: 12,598 12,557 12,490
Resistance levels: 12,685 12,729 12,781