
The EUR/USD currency pair
Technical indicators of the currency pair:
Prev Open: 1.14401
Open: 1.15413
% chg. over the last day: +0.98
Day’s range: 1.15344 – 1.15697
52 wk range: 1.1214 – 1.2557
The demand for USD is weakened after the FOMC Minutes publication. Some federal reserve representatives consider that they should keep the key interest range at the same level. The EUR/USD growth increased by 120 points and updated the key extremums. At the moment the quotes are consolidating around 1.15300-1.15700, positions should be opened from these levels. The financial market participants are waiting for the protocol of the last ECB meeting regarding the monetary policy.
The Economic News Feed for 10.01.2019:
Publication of the ECB meeting protocol regarding the monetary policy (EU) – 14:30 (GMT+2:00);
You should keep an eye on the US real estate report and the statement by the Head of the Federal Reserve, Jerome Powell.
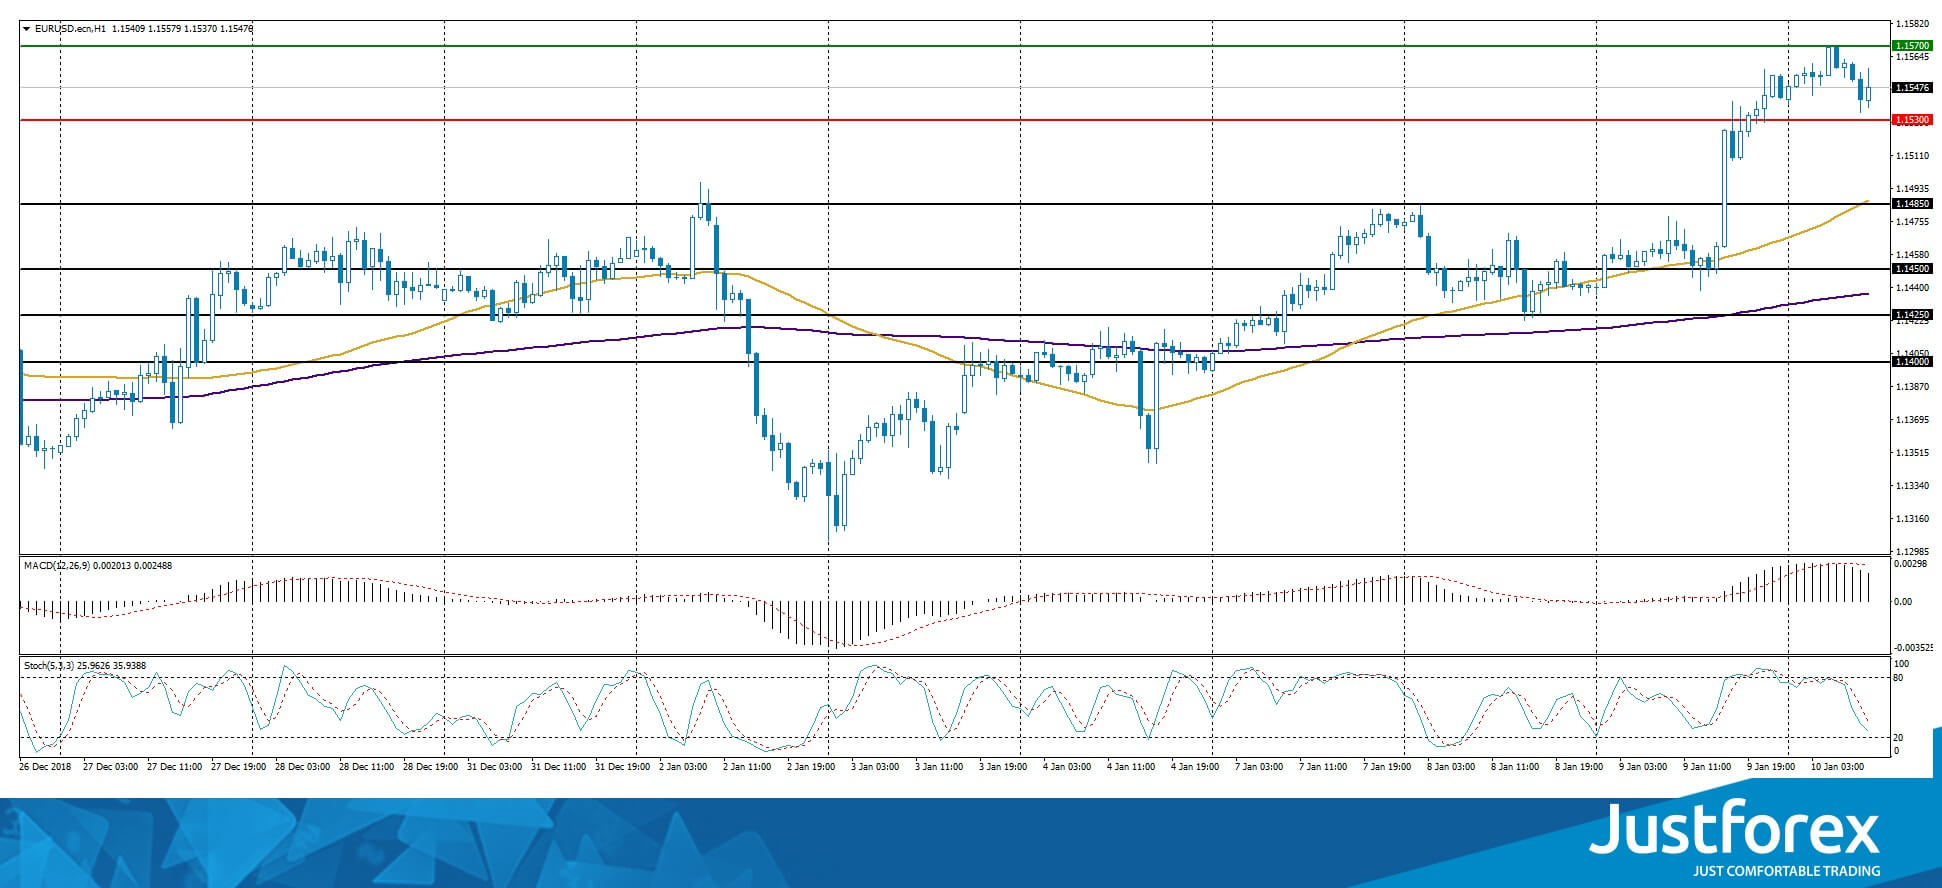
The price fixed above 50 MA and 200 MA, which points toward the power of the buyers.
The MACD histogram is in the positive zone but below the signal line, which gives a weak signal to buy EUR/USD.
The Stochastic Oscillator is in the neutral zone, the %K line is below the %D line which points toward the correction of the EUR/USD quotes.
Trading recommendations
Support levels: 1.15300, 1.14850, 1.14500
Resistance levels: 1.15700, 1.16000
If the price fixes above the resistance level of 1.15700 expect further growth of the EUR/USD. The movement will tend toward 1.16000-1.16300.
Alternatively the quotes can correct toward 1.15000-1.14800.
The GBP/USD currency pair
Technical indicators of the currency pair:
Prev Open: 1.27115
Open: 1.27889
% chg. over the last day: +0.63
Day’s range: 1.27504 – 1.27997
52 wk range: 1.2438 – 1.4378
The technical picture on the GBP/USD currency pair remains ambiguous. The pound is moving sideways. The key levels are 1.27500 and 1.28000, you should open positions from these levels. A correction is possible soon, consider keeping an eye on the relevant Brexit intel.
The Economic News Feed for 10.01.2019 is calm.
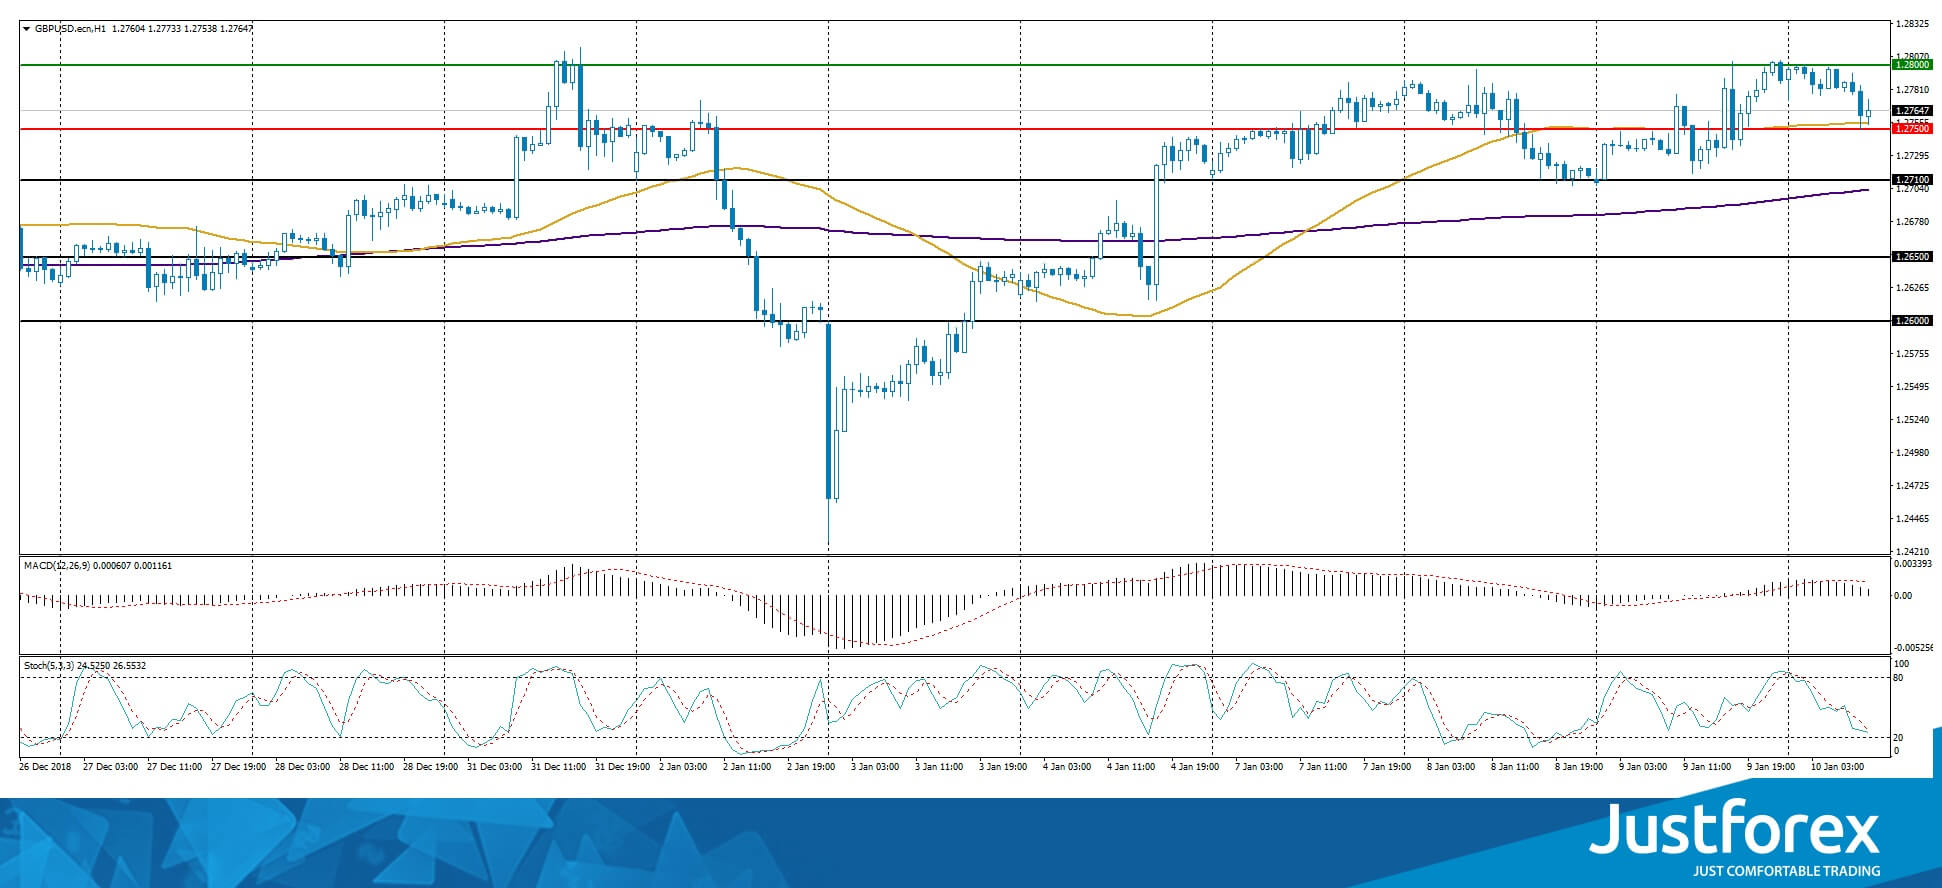
The indicators do not provide signals, the price is testing 50 MA.
The MACD histogram is in the positive zone but below the signal line, which suggests buying GBP/USD.
The Stochastic Oscillator is in the neutral zone, the %K line is below the %D line, which indicates a bearish mood.
Trading recommendations
Support levels: 1.27500, 1.27100, 1.26500
Resistance levels: 1.28000, 1.28500
If the price fixes above 1.28000 expect further growth of the quotes toward 1.28400-1.28600.
Alternatively the quotes can correct toward 1.27100-1.26800.
The USD/CAD currency pair
Technical indicators of the currency pair:
Prev Open: 1.32739
Open: 1.32061
% chg. over the last day: -0.46
Day’s range: 1.32010 – 1.32500
52 wk range: 1.2248 – 1.3664
USD/CAD is in a bearish mood. The CAD is supported by the positive dynamic of the oil quotes. The WTI futures grew by 5% yesterday. The USD/CAD quotes are consolidating around 1.32200-1.32700. Positions should be opened from these levels. A technical correction is possible soon.
The Economic News Feed for 10.01.2019 is calm. At 15:30 (GMT+2:00) Canada will publish some data on the real estate market.
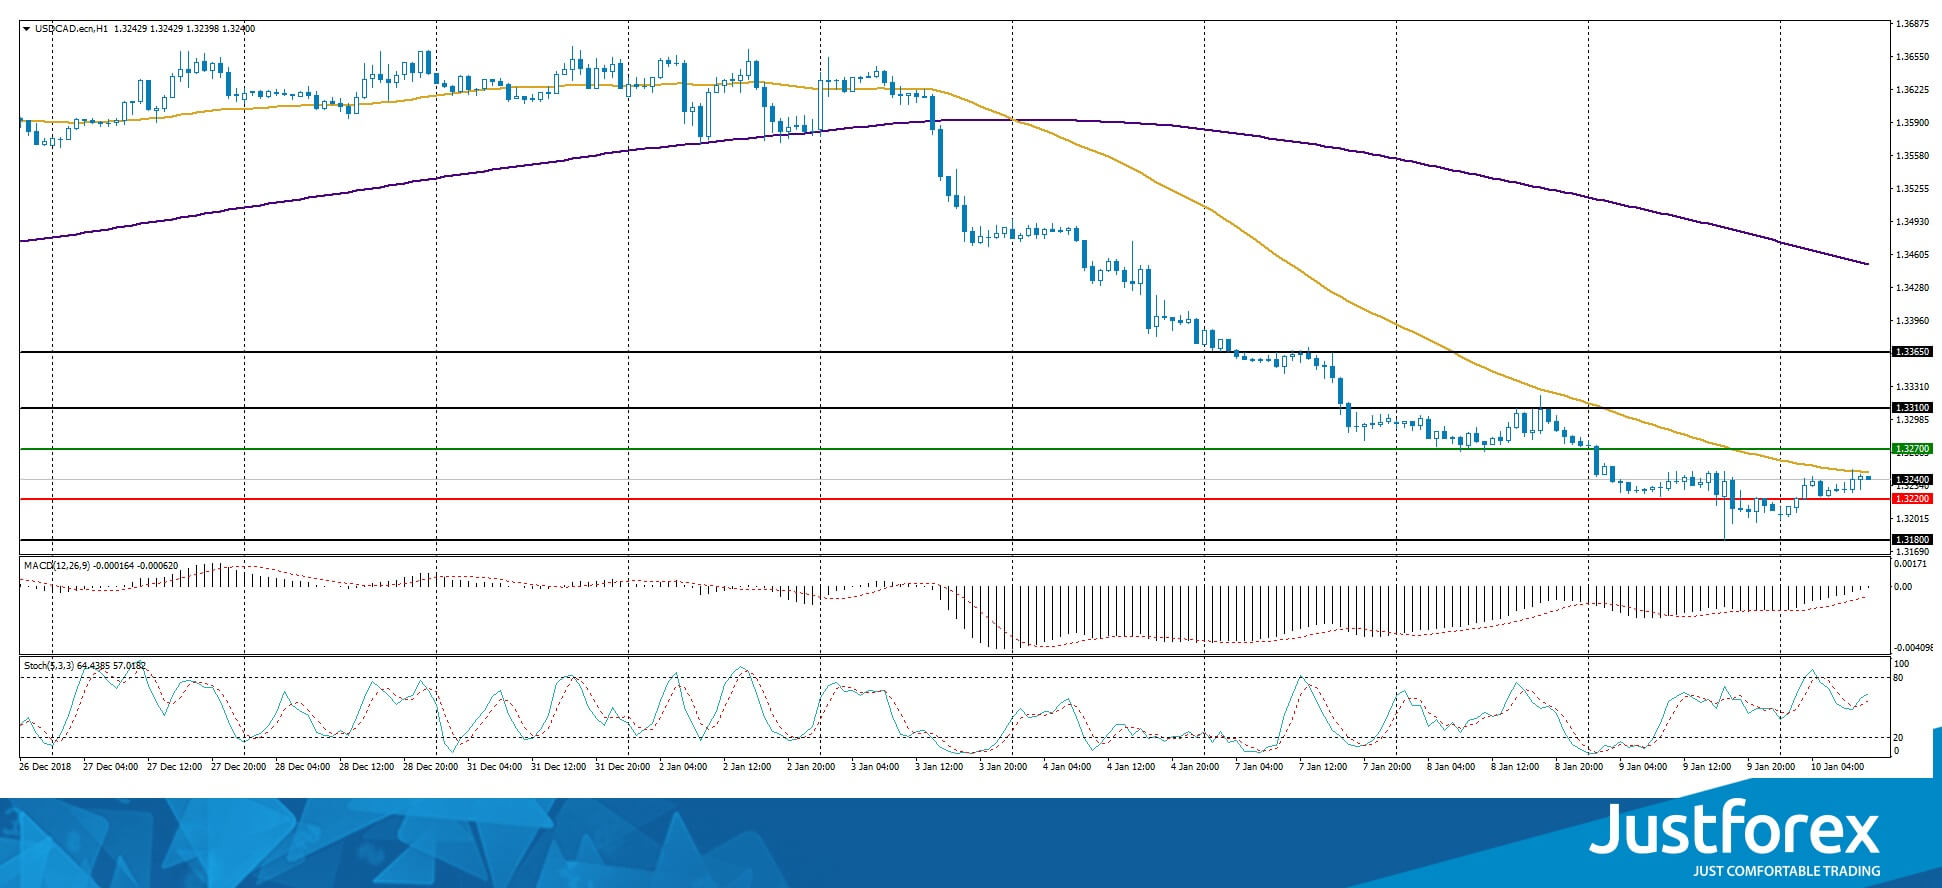
The indicators do not provide precise signals. The price is testing 50 MA which is a strong dynamic resistance.
The MACD histogram is close to 0.
The Stochastic Oscillator is in the neutral zone, the %K line is above the %D line, which points toward a correction of the USD/CAD.
Trading recommendations
Support levels: 1.32200, 1.31800
Resistance levels: 1.32700, 1.33100, 1.33650
If the price fixes above 1.32700 expect further growth of USD/CAD toward 1.33100-1.33500.
Alternatively the quotes can fall toward 1.31800-1.31600.
The USD/JPY currency pair
Technical indicators of the currency pair:
Prev Open: 108.727
Open: 108.132
% chg. over the last day: -0.52
Day’s range: 107.769 – 108.258
52 wk range: 104.56 – 114.56
The USD/JPY quotes started to descend. The yen strengthened against the USD by more than 60 points. The key support and resistance levels are 107.750 and 108.450, you should open positions from these levels. The trading instrument has further descend potential. Keep an eye on the US Tresure bonds yield dynamics.
The Economic News Feed for 10.01.2019 is calm.
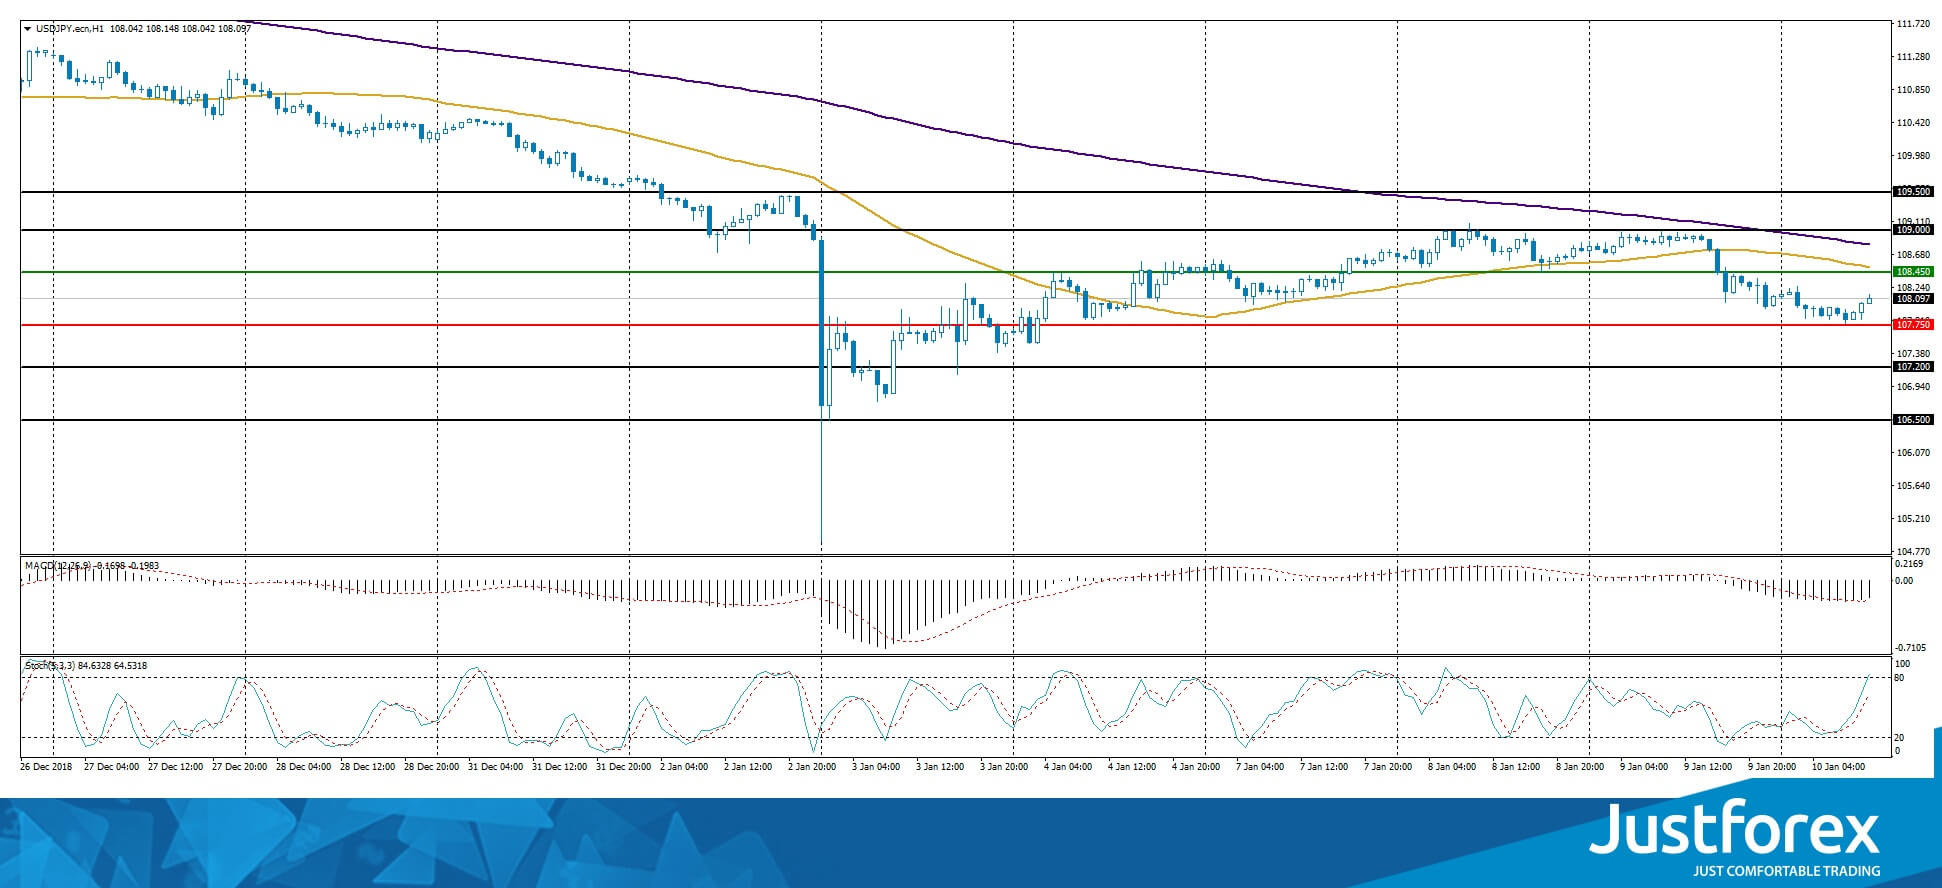
The price fixed between 50 MA and 200 MA which points toward the power of the sellers.
The MACD histogram is in the negative zone but above the signal line which provides a weak signal to sell USD/JPY.
The Stochastic Oscillator is in the neutral zone, the %K line is above the %D line, which points toward the bearish mood.
Trading recommendations
Support levels: 107.750, 107.200, 106.500
Resistance levels: 108.450, 109.000, 109.500
If the price fixes below 107.750 expect the descend toward 107.200-107.000.
Alternatively the quotes can recover toward 108.750-109.000.


