
The EUR/USD currency pair
Technical indicators of the currency pair:
Prev Open: 1.14111
Open: 1.13923
% chg. over the last day: -0.16
Day’s range: 1.13824 – 1.13985
52 wk range: 1.1214 – 1.2557
Yesterday EUR/USD was in a bearish mood. The USD is slightly strengthened against the EUR. The technical picture remains ambiguous, the quotes are moving sideways. The key levels are 1.13800 and 1.14100. You should open positions from these levels. A technical correction is possible soon.
The Economic News Feed for 17.01.2019:
Consumer Price Index (EU) – 12:00 (GMT+2:00);
Real Estate Market Report (US) – 15:30 (GMT+2:00);
PMI Index by the Federal Reserve of Philadelphia (US) – 15:30 (GMT+2:00).
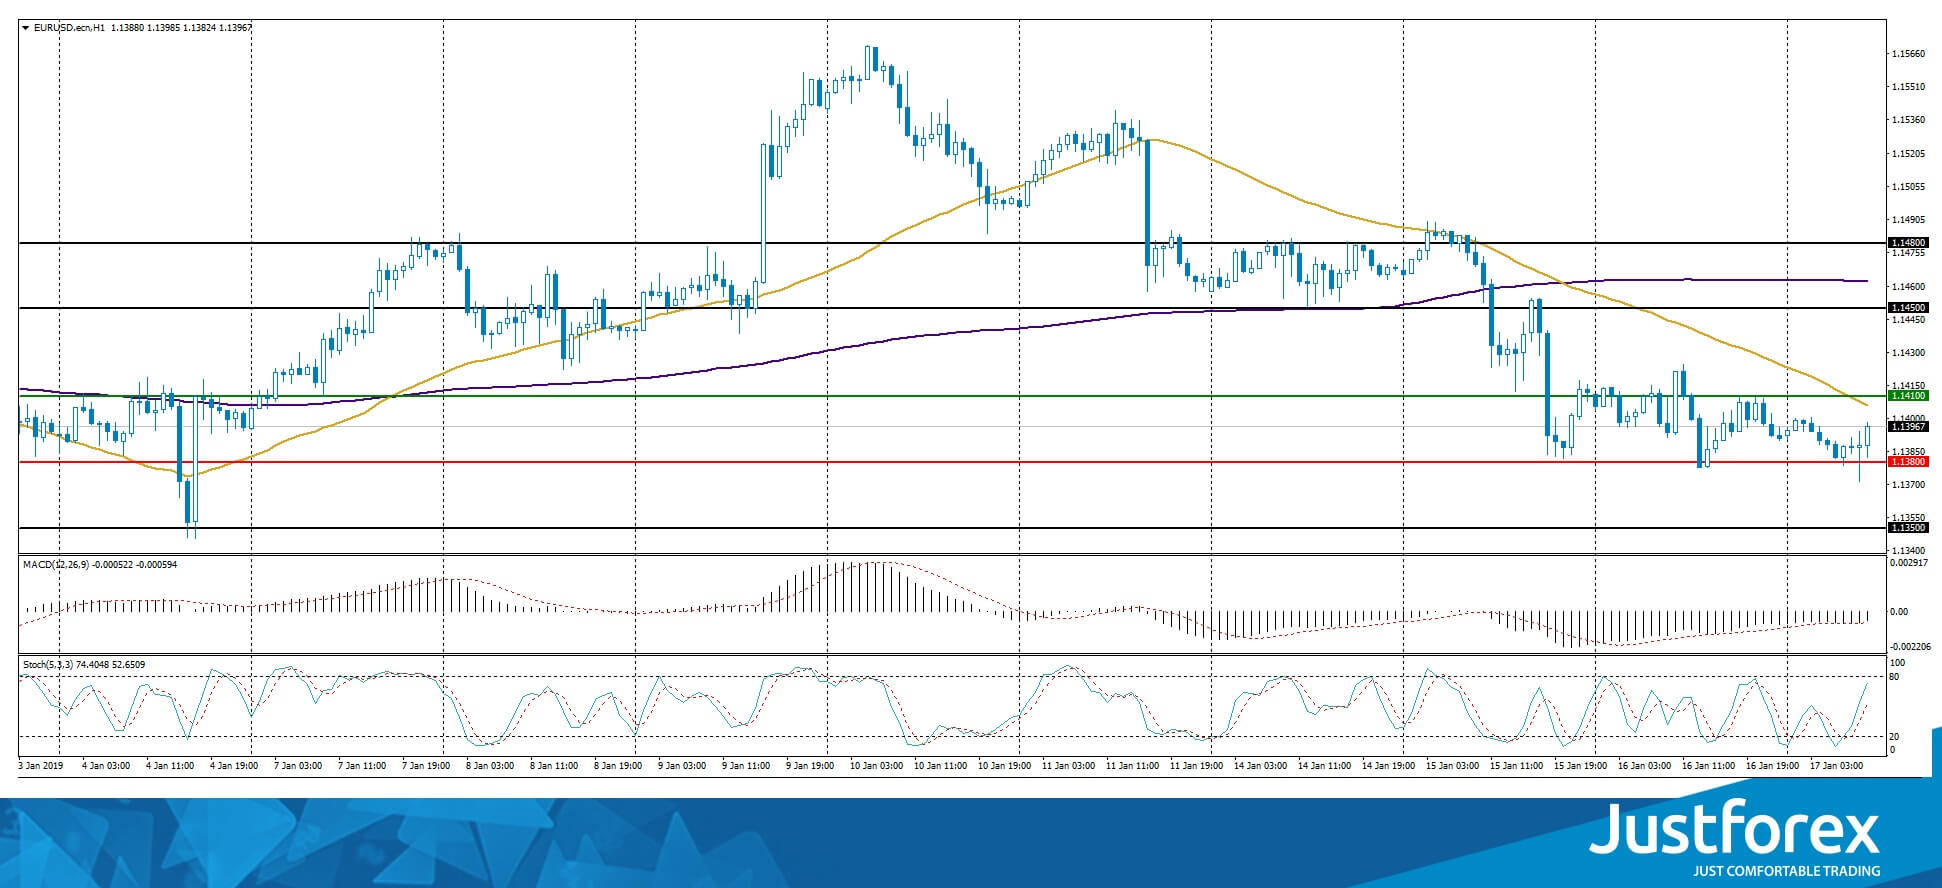
The indicators point to the power of the buyers, the price fixes below 50 MA and 200 MA.
The MACD histogram is in the negative zone but above the signal line which gives a weak signal to sell EUR/USD.
The Stochastic Oscillator is in the neutral zone, the %K line is above the %D line which points to a bullish mood.
Trading recommendations
Support levels: 1.13800, 1.13500
Resistance levels: 1.14100, 1.14500, 1.14800
Should the price fix above 1.14100 expect the quotes to correct toward 1.14500-1.14800.
Alternatively the quotes can fall toward 1.13500-1.13300.
The GBP/USD currency pair
Technical indicators of the currency pair:
Prev Open: 1.28573
Open: 1.28775
% chg. over the last day: +0.21
Day’s range: 1.28628 – 1.28705
52 wk range: 1.2438 – 1.4378
GBP/USD is showing a variety of trends. Yesterday the UK published the Consumer Price Index, which grew by 2.1%, as expected. You should open positions from the key levels 1.28500 and 1.28900.
The Economic News Feed for 17.01.2019 is calm.
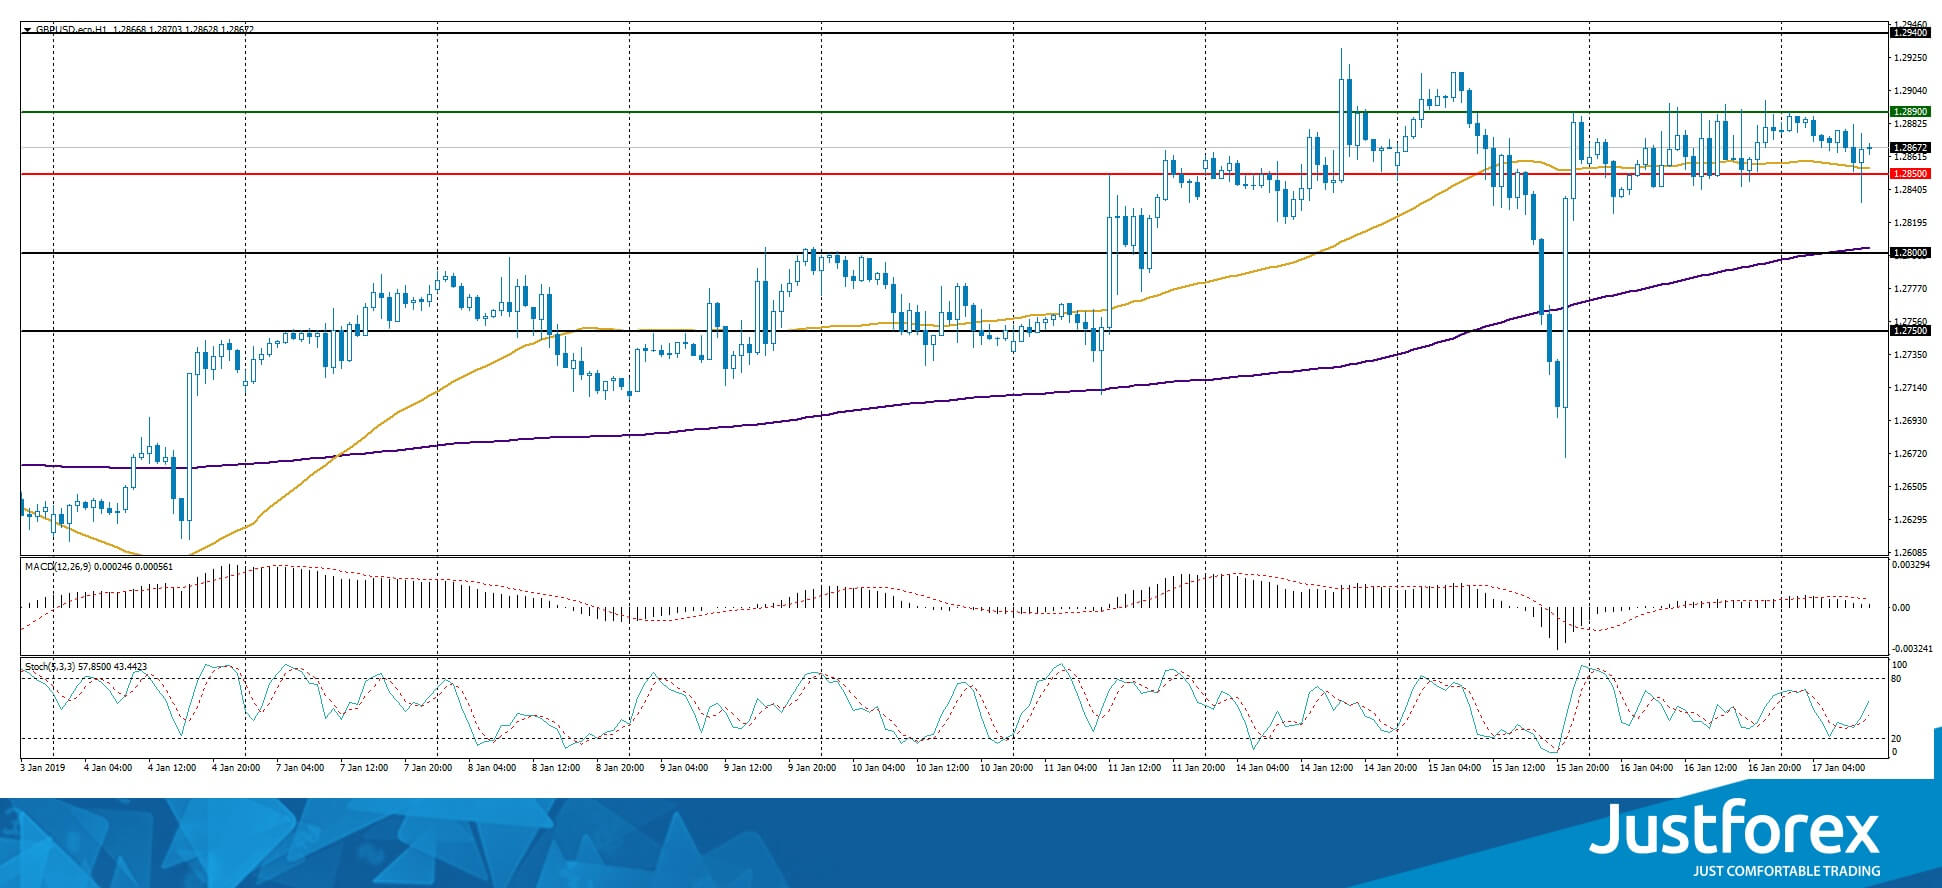
The price fixed above 50 MA and 200 MA which points to the power of the buyers.
The MACD histogram is close to 0. There are no signals.
The Stochastic Oscillator is in the neutral zone, the %K line is above the %D line which points to a bullish mood.
Trading recommendations
Support levels: 1.28500, 1.28000, 1.27500
Resistance levels: 1.28900, 1.29400
If the price fixes below 1.28500, look for market entry points to open short positions. The movement will tend toward 1.28000-1.27800.
Alternatively the quotes can grow toward 1.29400-1.29600.
The USD/CAD currency pair
Technical indicators of the currency pair:
Prev Open: 1.32685
Open: 1.32530
% chg. over the last day: -0.06
Day’s range: 1.32769 – 1.32880
52 wk range: 1.2248 – 1.3664
USD/CAD keeps showing an ambiguous technical picture. Today the quotes slightly grew. The investors are waiting for additional drivers. Right now the key support and resistance levels are 1.32700 and 1.33000. You should open positions from these levels. The quotes can grow further.
The Economic News Feed for 17.01.2019 is calm
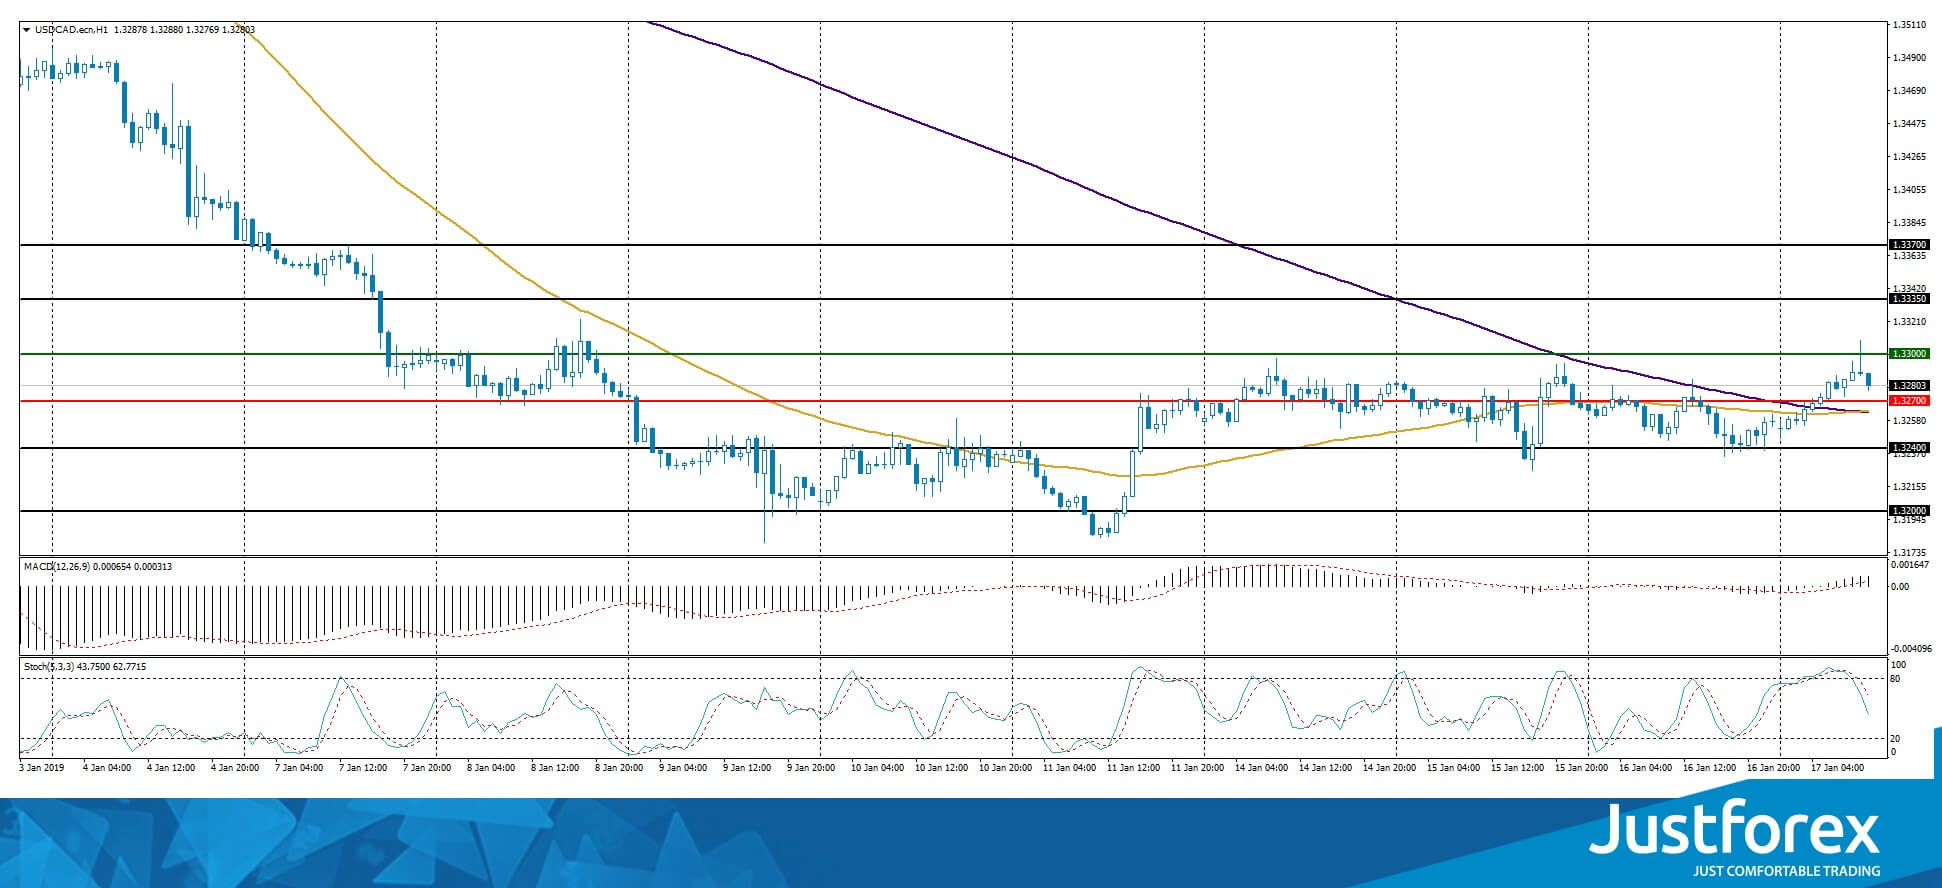
The indicators do not provide signals, 50 MA has crossed 200 MA.
The MACD histogram is in the positive zone, which points toward a bullish mood.
The Stochastic Oscillator is in the neutral zone, the %K line is below the %D line, which gives a signal to sell USD/CAD.
Trading recommendations
Support levels: 1.32700, 1.32400, 1.32000
Resistance levels: 1.33000, 1.33350, 1.33700
If the price fixes above 1.33000 consider buying USD/CAD. The movement will tend toward 1.33350-1.33500.
Alternatively the quotes can fall toward 1.32400-1.32200.
The USD/JPY currency pair
Technical indicators of the currency pair:
Prev Open: 108.653
Open: 109.102
% chg. over the last day: +0.35
Day’s range: 108.763 – 108.843
52 wk range: 104.56 – 114.56
USD/JPY was in a bullish mood. The quotes grew by 60 points. However, it is in a bearish mood now, with the key levels being 108.700 and 109.000. The quotes have a tendency to descend further.
The Economic News Feed for 17.01.2019 is calm.
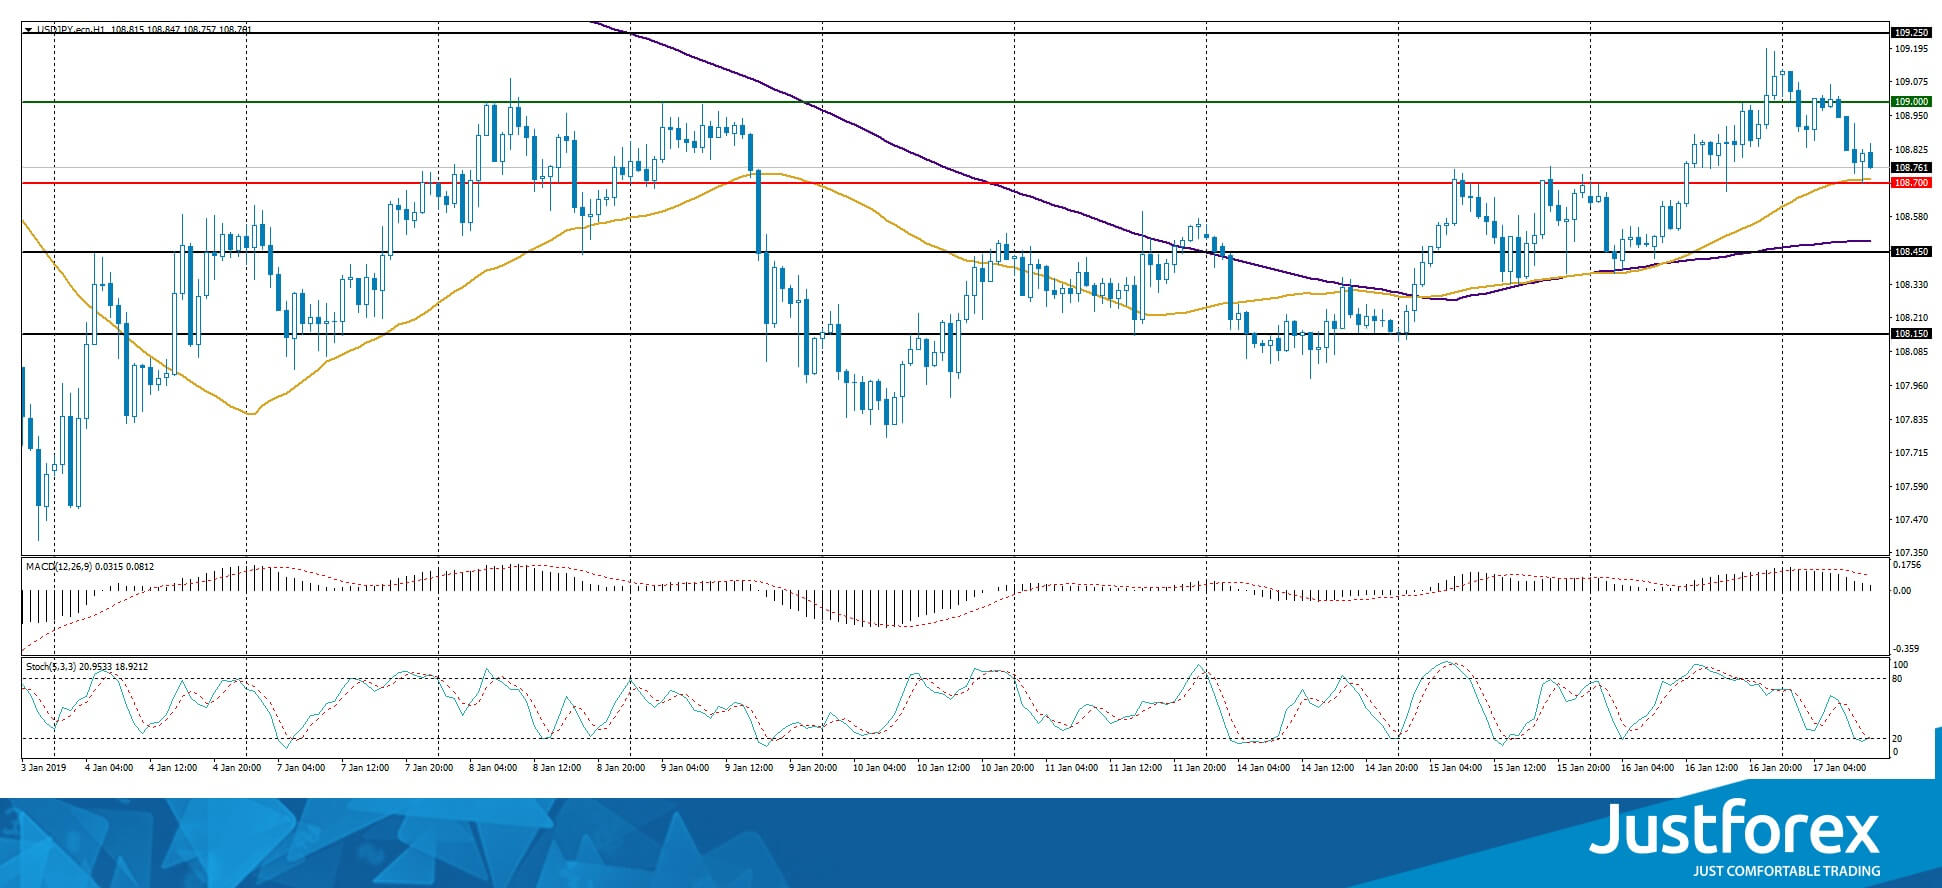
The price fixed above 50 MA and 200 MA which points towards the power of the buyers.
The MACD histogram is in the positive zone but below the signal line, which gives a weak signal to buy USD/JPY.
The Stochastic Oscillator is near the oversold zone, the %K line is crossing the %D line. There are no signals.
Trading recommendations
Support levels: 108.700, 108.450, 108.150
Resistance levels: 109.000, 109.250
If the price fixes below the mirror support 108.700 expect the quotes to fall further toward 108.450-108.200.
Alternatively the quotes can grow toward 109.250-109.500.


