
The EUR/USD currency pair
Technical indicators of the currency pair:
Prev Open: 1.13010
Open: 1.14006
% chg. over the last day: +0.96
Day’s range: 1.13928 – 1.14256
52 wk range: 1.1214 – 1.2557
EUR started to recover after a significant downfall during the last two weeks. On Friday, January 25, the quotes have grown by 100 points and updated the key extremums. A political conflict is ongoing in the White House. Last week Donald Trump finally signed off on the temporary financing of the government until February 15. The currency pair is consolidating around 1.13800-1.14250. You should open positions from these levels. The key events this week will be the Federal Reserve meeting and the US Labour Market report for January.
The Economic News Feed for 28.01.2019 is calm. Keep an eye on the statements made by the head of the EU Central Bank.
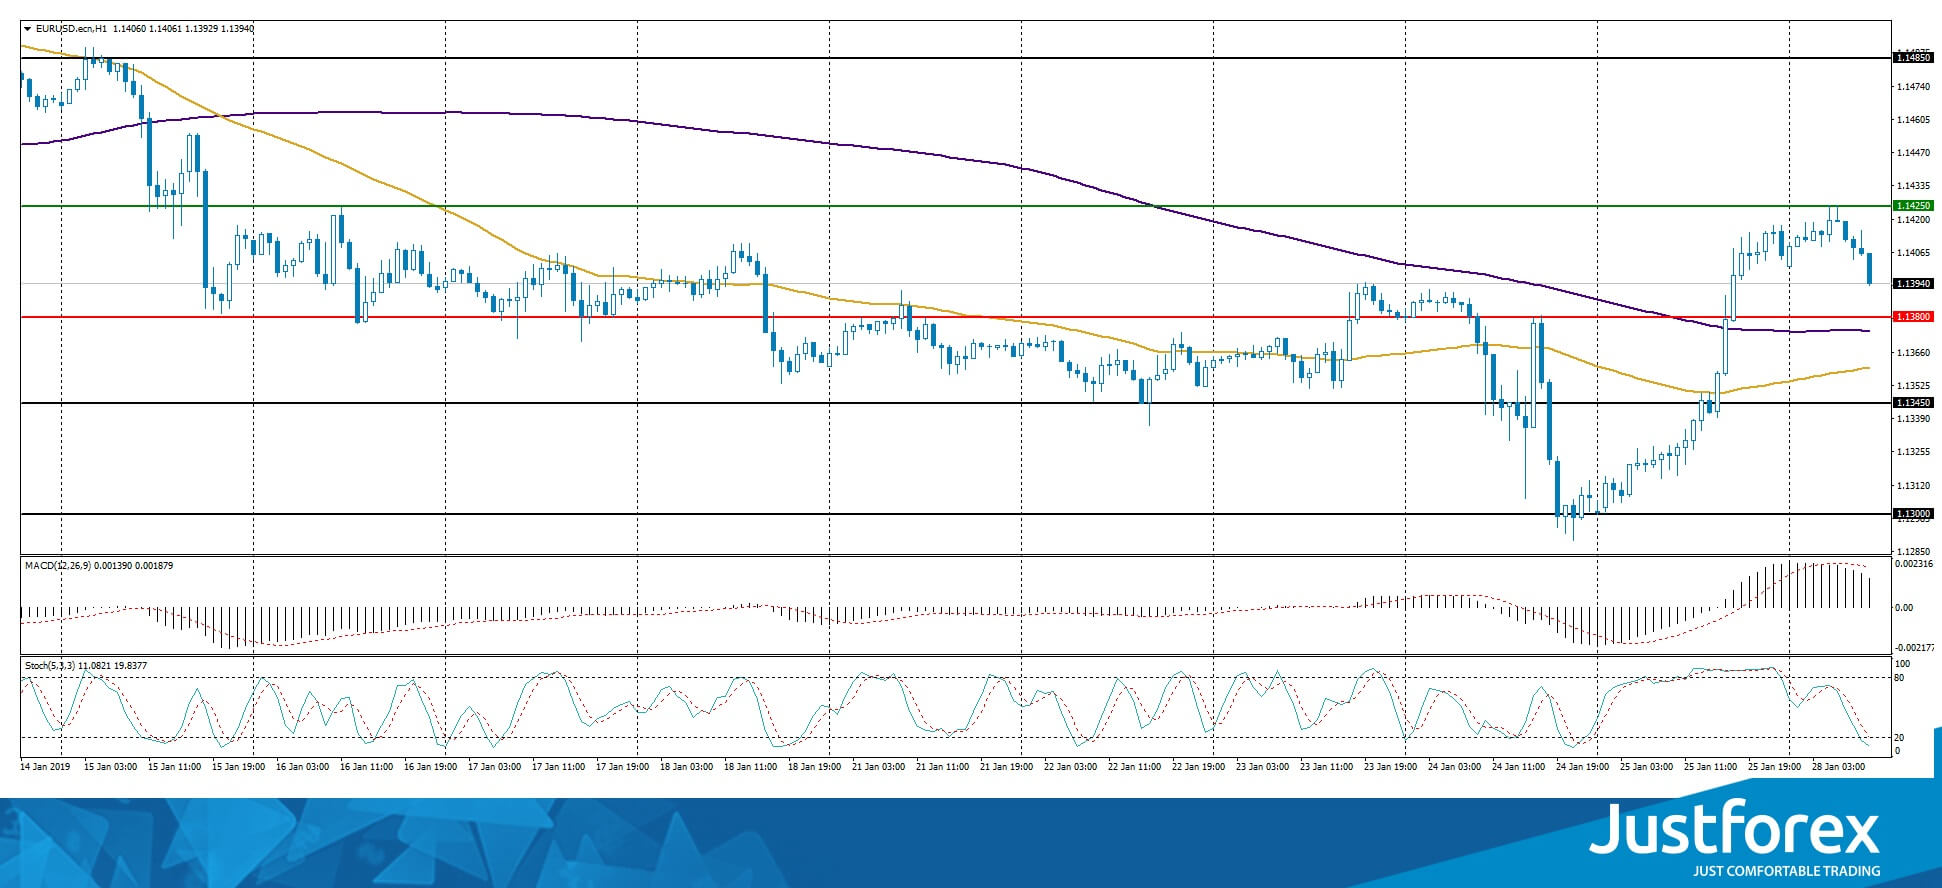
The price fixed above the 50 MA and 200 MA which points to the power of the buyers.
The MACD histogram is in the positive zone but below the signal line, which gives a weak signal to buy EUR/USD.
The Stochastic Oscillator reached the oversold zone, the %K line is below the %D line which gives a weak signal to sell EUR/USD.
Trading recommendations
Support levels: 1.13800, 1.13450, 1.13000
Resistance levels: 1.14250, 1.14850
If the price fixes above the local support 1.14250, consider buying EUR/USD. The movement will tend toward 1.14600-1.14800.
Alternatively the quotes can descend toward 1.13500-1.13300.
The GBP/USD currency pair
Technical indicators of the currency pair:
Prev Open: 1.30624
Open: 1.31838
% chg. over the last day: +1.05
Day’s range: 1.31614 – 1.32110
52 wk range: 1.2438 – 1.4378
GBP/USD keeps showing a stable ascending trend. Right now the pount is consolidating around the 3mo maximums. The key levels are 1.31350 and 1.32150. A technical correction is possible soon. The investors are waiting for a vote in the British Parliament regarding the Brexit plan proposed by Theresa May. You should open positions from the key levels.
Keep an eye on the statements made by the head of the Bank of England.
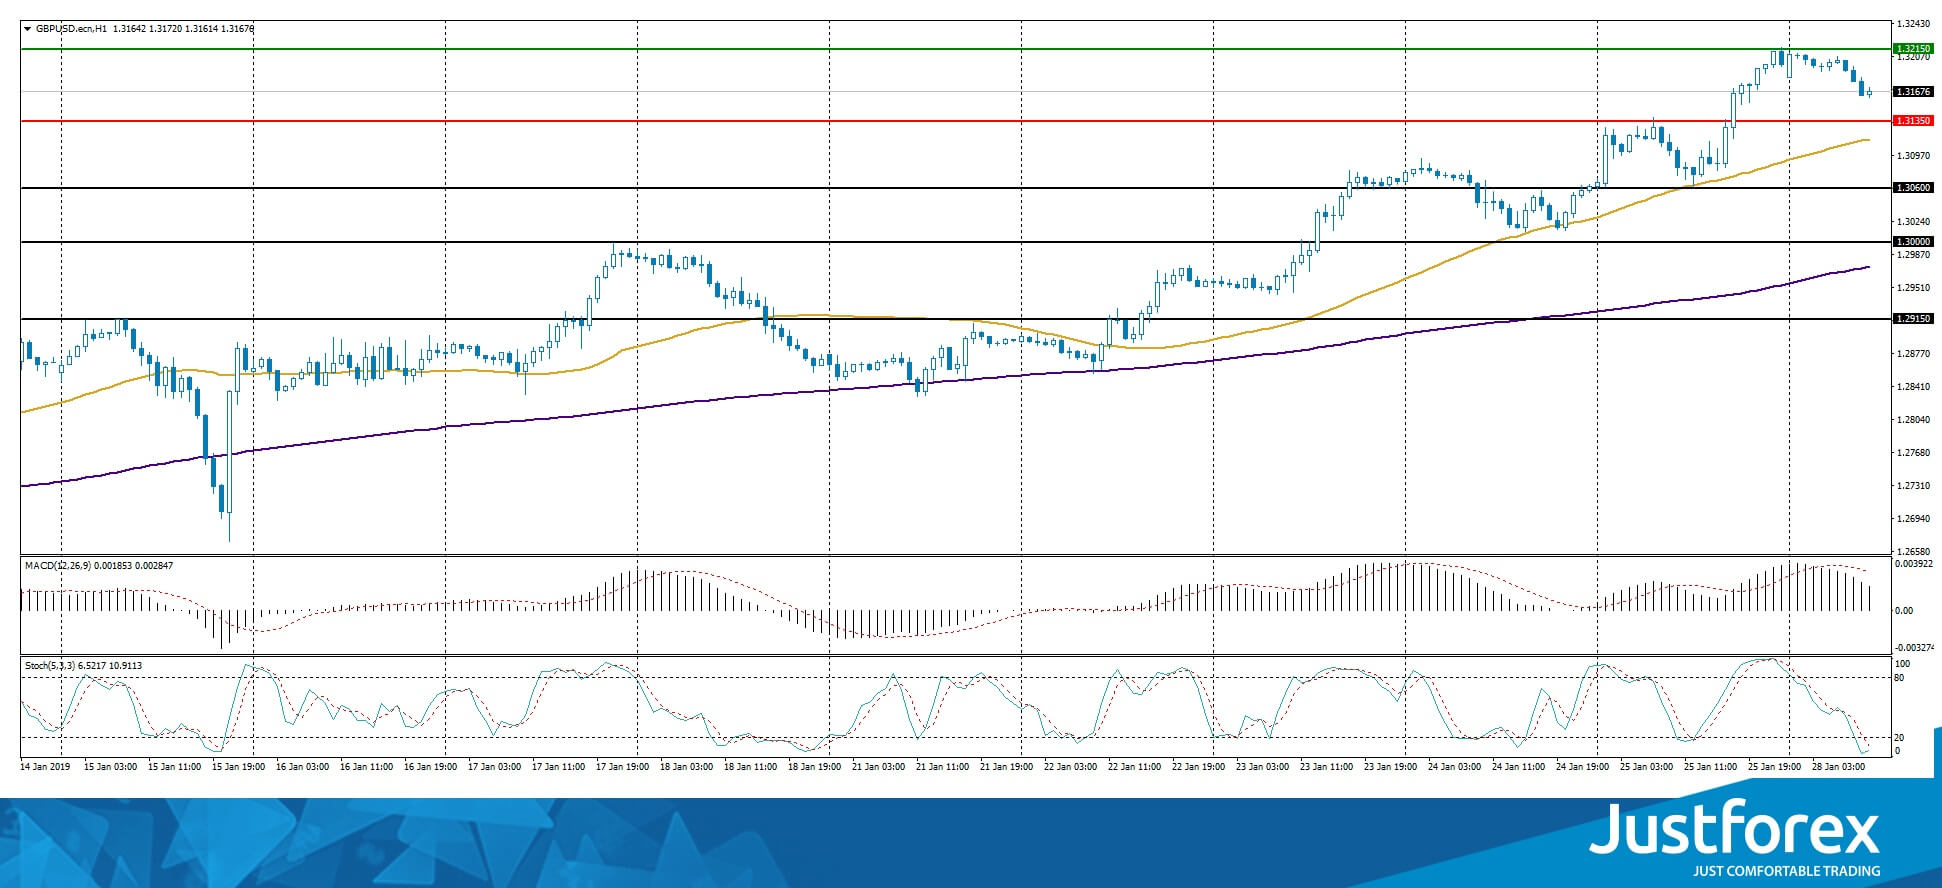
The price fixed above 50 MA and 200 MA which shows the power of the buyers.
The MACD histogram is in the positive zone but below the signal line, which gives a weak signal to buy EUR/USD.
The Stochastic Oscillator is in the oversold zone, the %K line started to cross the %D line. There are no signals at the moment.
Trading recommendations
Support levels: 1.31350, 1.30600, 1.30000
Resistance levels: 1.32150, 1.32500
If the price fixes above 1.32150, consider looking for the market entry points to open long positions. The movement will tend toward 1.32500-1.32750.
Alternatively the quotes can correct toward 1.30700-1.30400.
The USD/CAD currency pair
Technical indicators of the currency pair:
Prev Open: 1.33455
Open: 1.32183
% chg. over the last day: -0.97
Day’s range: 1.32030 – 1.32281
52 wk range: 1.2248 – 1.3664
USD/CAD had a rather aggressive sell-off on Friday, January 25. CAD added more than 120 points to ints value and updated the local extremums. Right now the quotes are consolidating around 1.32000 and 1.32300. The quotes can descend further. Keep an eye on the oil quotes dynamics.
The Economic News Feed for 28.01.2019 is calm.
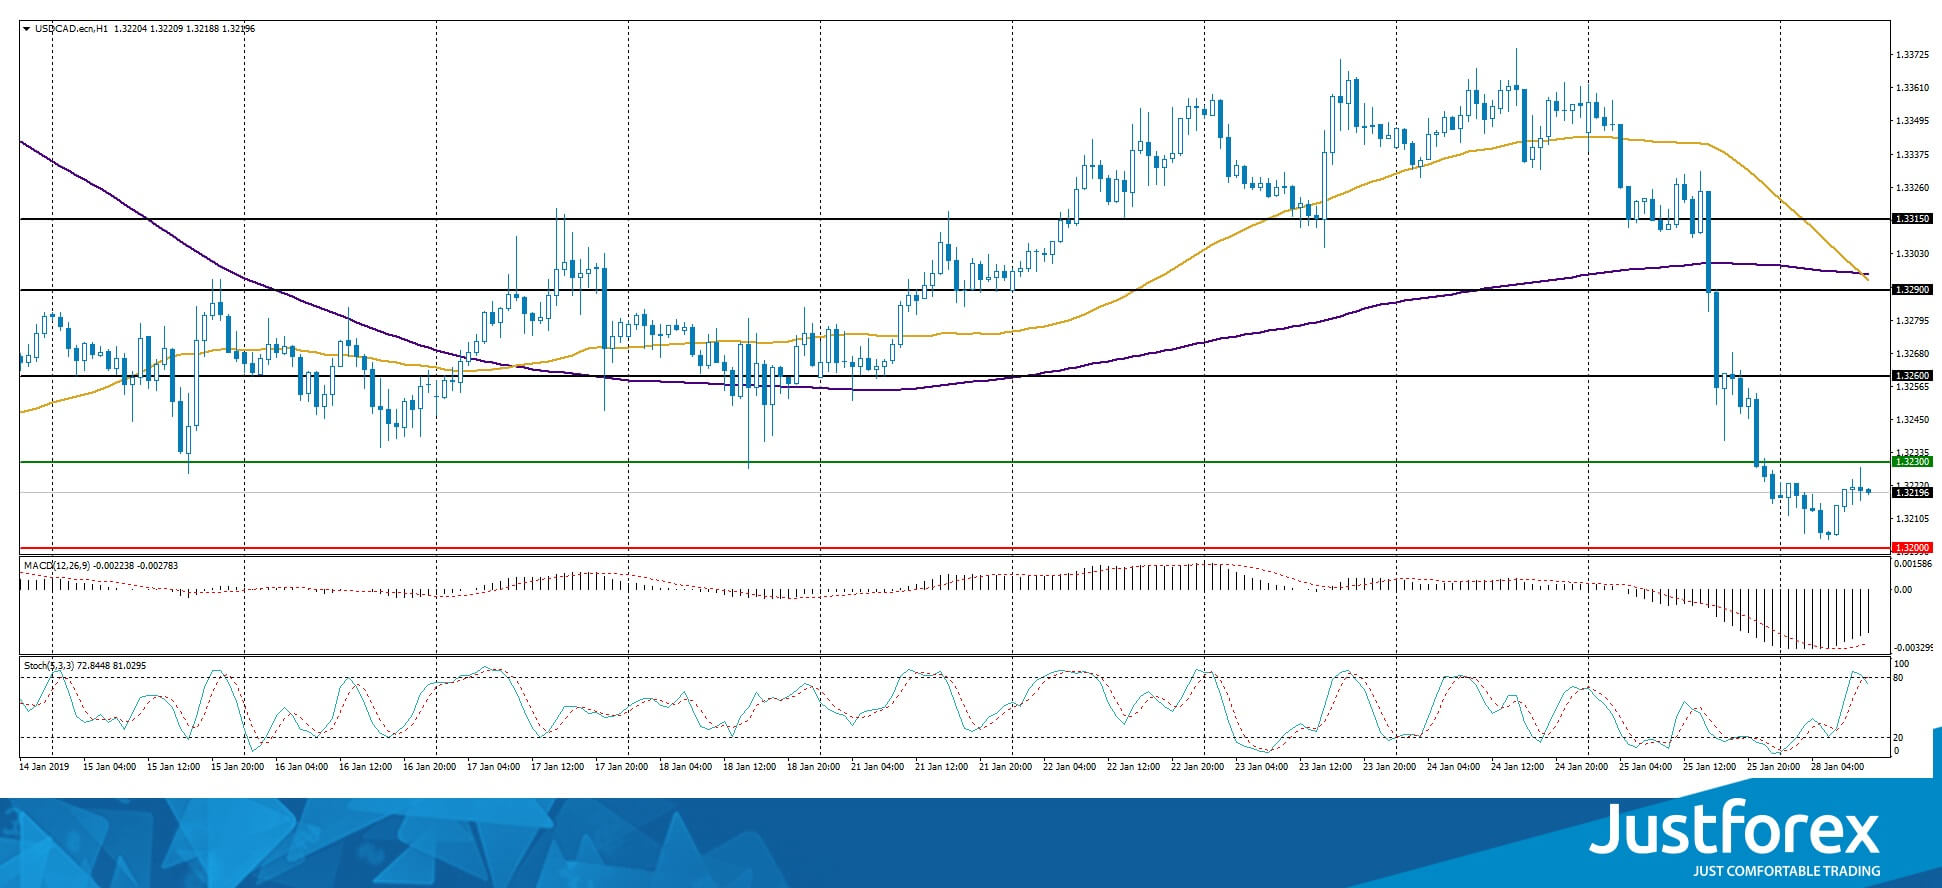
The price fixed below 50 MA and 200 MA which points to the power of the buyers.
The MACD histogram is in the negative zone but above the signal line which gives a weak signal to sell USD/CAD.
The Stochastic Oscillator is near the overbought zone, the %K line is crossing the %D line. There are no signals at the moment.
Trading recommendations
Support levels: 1.32000, 1.31500
Resistance levels: 1.32300, 1.32600, 1.32900
If the price falls lower than the round 1.32000, the quotes can descend toward 1.31600-1.31400..
Alternatively, the quotes can correct toward 1.32500-1.32750.
The USD/JPY currency pair
Technical indicators of the currency pair:
Prev Open: 109.625
Open: 109.541
% chg. over the last day: -0.08
Day’s range: 109.265 – 109.574
52 wk range: 104.56 – 114.56
USD/JPY is consolidating in the narrow range. The currenct technical picture indicates a development of a bearish mood. The key support and resistance levels are 109.250 and 109.500. You should open positions from these levels. Keep an eye on the US Treasury bonds yield.
The Economic News Feed for 28.01.2019 is calm.
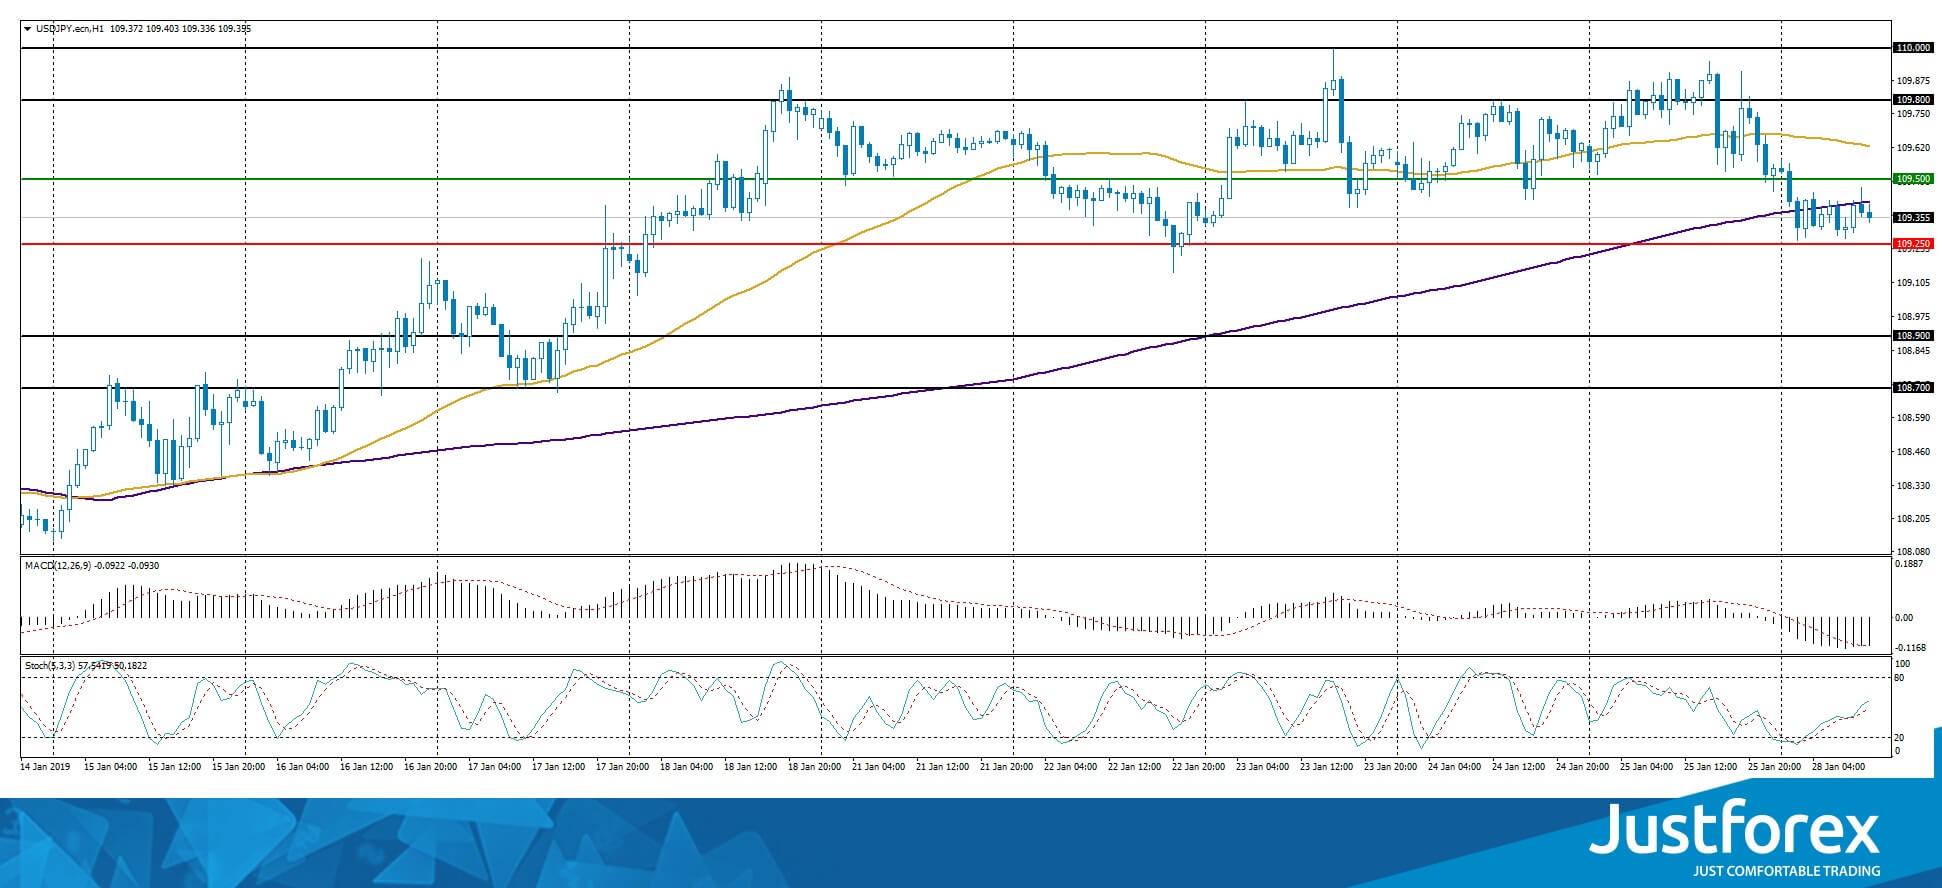
The indicators do not provide precise signals, the price has crossed 200 MA.
The MACD histogram is in the negative zone and below the signal line, which gives a strong signal to sell USD/JPY.
The Stochastic Oscillator is in the neutral zone, the %K line is above the %D line which points to a bullish mood.
Trading recommendations
Support levels: 109.250, 108.900, 108.700
Resistance levels: 109.500, 109.800, 110.000
If the quotes fix below the local support of 109.250, expect the quotes to descend toward 108.900-108.700.
Alternatively the quotes can grow toward 109.750-110.000.


