
A note on lower timeframe confirming price action…
Waiting for lower timeframe confirmation is our main tool to confirm strength within higher timeframe zones, and has really been the key to our trading success. It takes a little time to understand the subtle nuances, however, as each trade is never the same, but once you master the rhythm so to speak, you will be saved from countless unnecessary losing trades. The following is a list of what we look for:
- A break/retest of supply or demand dependent on which way you’re trading.
- A trendline break/retest.
- Buying/selling tails … essentially we look for a cluster of very obvious spikes off of lower timeframe support and resistance levels within the higher timeframe zone.
- Candlestick patterns. We tend to only stick with pin bars and engulfing bars as these have proven to be the most effective.
We typically search for lower-timeframe confirmation between the M15 and H1 timeframes, since most of our higher-timeframe areas begin with the H4. Stops are usually placed 1-3 pips beyond confirming structures.
EUR/USD
Weekly gain/loss: – 29 pips
Weekly closing price: 1.1178
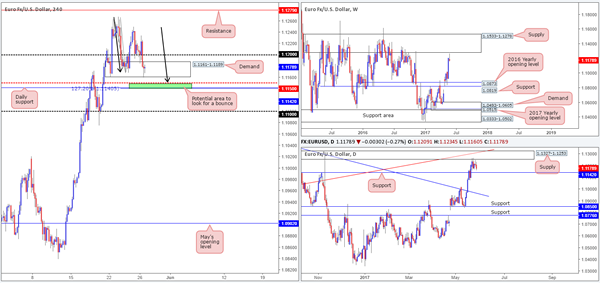
Over the course of last week’s trading, we saw the single currency come up to within striking distance of a formidable weekly supply area coming in at 1.1533-1.1278. The zone has managed to cap upside since May 2015, so it’s not a base one should overlook. What’s also interesting is the recently formed weekly selling wick, also known as a bearish pin bar. In the event that the bears continue to push lower this week, the next downside target can be seen at 1.0873: the 2016 yearly opening line.
Glued to the underside of the said weekly supply area is a daily supply zone visible at 1.1327-1.1253. This zone, as you can see, held firm last week and has consequently placed the daily candles just ahead of a support level drawn from 1.1142. Therefore, it may be prudent to wait for price to engulf this daily line before contemplating selling the bearish weekly pin bar.
A quick recap of Friday’s movement on the H4 timeframe shows that the 1.12 handle was taken out. This move, influenced by upbeat US Prelim GDP figures, ended with price challenging the lower limits of demand pegged at 1.1161-1.1189. Although this demand has effectively held ground, the main interest remains around the H4 mid-level support seen below at 1.1150. What makes this level attractive is the converging H4 AB=CD (see black arrows) 127.2% Fib ext. at 1.1140 taken from the high 1.1268, and the daily support mentioned above at 1.1142. Together, this forms a small, yet high-probability, buy zone (green rectangle).
Our suggestions: While we do expect to see a bounce from the 1.1142/1.1150 neighborhood, there are two cautionary points to consider here. Firstly, let’s remember that weekly sellers produced a bearish selling wick just beneath the weekly supply zone last week, which could imply further selling in this market. Secondly, the current H4 demand could potentially act as a nearby resistance once consumed.
Should you consider 1.1142/1.1150 to be a valid buy zone, we would strongly recommend adopting aggressive trade management from here, since getting caught on the wrong side of weekly flow would not be a pleasant experience.
Data points to consider: ECB President Draghi speaks at 2pm GMT+1. US banks are closed in observance of Memorial Day.
Levels to watch/live orders:
- Buys: 1.1142/1.1150 ([potential buy zone – strict trade management advised] stop loss: a few pips below 1.1142).
- Sells: Flat (stop loss: N/A).
GBP/USD
Weekly gain/loss: – 228 pips
Weekly closing price: 1.2805
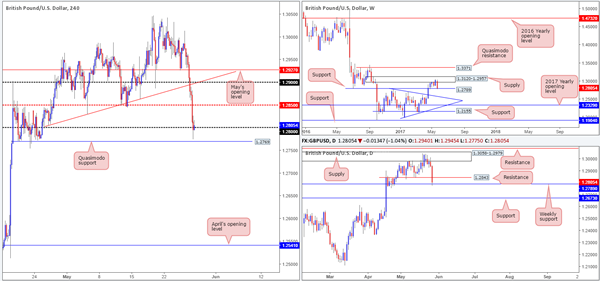
Try as it might, the GBP/USD could not muster enough strength to breach weekly supply at 1.3120-1.2957 last week. This saw the pair subsequently selloff (erasing the prior week’s gains) and challenge weekly support at 1.2789 going into the close.
Daily support at 1.2843 was wiped out during Friday’s session, allowing price to shake hands with the above noted weekly support level. Should this weekly barrier give way, the next downside target on the daily timeframe is a support fixed at 1.2673. With this level having provided strong resistance on several occasions in the past, there’s a good chance this line will offer support should it be tested.
A brief look at recent dealings on the H4 chart shows multiple tech supports were erased throughout Friday’s segment. The selloff was strengthened by both upbeat US Prelim GDP numbers and the latest UK election poll results. As of writing, the Conservative party’s lead has significantly narrowed from previous weeks.
H4 Price pierced the 1.28 handle, and just missed tapping the nearby Quasimodo support at 1.2769, before concluding the week marginally closing back above 1.28.
Our suggestions: Although H4 price did indeed manage to close back above 1.28, it, in our opinion, lacks staying power as the candle was able to print a minor bearish correction. Supposing that we witness a more decisive close form above 1.28, it’s highly likely that the market will look to target the H4 mid-level resistance at 1.2850 (sits just above daily resistance marked at 1.2843).
Also of interest would be a test of the aforementioned H4 Quasimodo support. The stops taken from 1.28 would likely provide enough liquidity for the big boys to begin buying this market. What’s more, let’s remember that we are also trading from a weekly support at the moment.
Therefore, we believe this Quasimodo level, as well as a reasonable H4 close forming above 1.28, is stable enough price action to consider buy trades.
Data points to consider: Both UK (in observance of Spring Bank Holiday) and US (in observance of Memorial Day) banks are closed.
Levels to watch/live orders:
- Buys: Buys are possible following a more decisive H4 bullish close above 1.28 (stop loss: ideally beyond the trigger candle’s tail). 1.2769 region ([pending order] stop loss: 1.2748).
- Sells: Flat (stop loss: N/A).
AUD/USD
Weekly gain/loss: – 11 pips
Weekly closing price: 0.7445
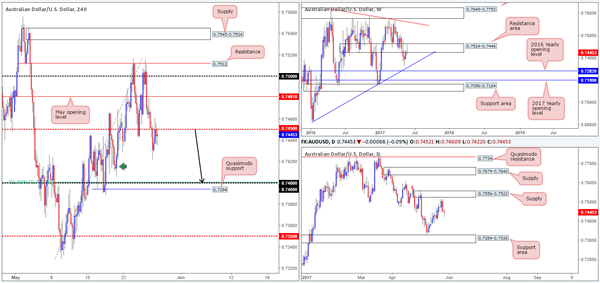
Kicking this morning’s report off from the weekly timeframe, it’s clear to see that the sellers have stamped in some authority within the resistance area planted at 0.7524-0.7446. This produced a reasonably strong-looking selling wick last week that could imply further downside may be on the cards. Neighboring support rests in the form of a nearby trendline support etched from the low 0.6827.
Turning our attention to the daily candles, price topped just ahead of a supply base coming in at 0.7556-0.7523, which happens to be situated directly above the said weekly resistance area. We do not see much in the way of support on this scale until we reach the support zone marked at 0.7284-0.7326 (fuses nicely with the aforementioned weekly trendline support).
Bouncing over to the H4 timeframe, we can see that the mid-level support at 0.7450 was taken out and later on retested as resistance on Friday which was a noted move to watch for in Thursday’s report. Based on 0.7450 holding firm, we feel price may look to target the 0.74 handle today. Granted, we do have a H4 demand lurking nearby marked with a green arrow around 0.7420, which may produce a minor reaction. The more appealing area, however, remains around the 0.74 level, since it merges with a 61.8% Fib support taken from the low 0.7328 and a H4 Quasimodo support at 0.7394.
Our suggestions: Personally, we would wait for a second retest of 0.7450 to take shape and then look to assess the response. If price chalks up a reasonably sized H4 bearish rejection candle (a full-bodied candle would be perfect), then a short would be permitted from here with an initial target objective set at 0.74.
Data points to consider: US banks are closed in observance of Memorial Day.
Levels to watch/live orders:
- Buys: Flat (stop loss: N/A).
- Sells: 0.7450 ([waiting for a reasonably sized H4 bear candle to form is advised] stop loss: ideally beyond the candle’s wick).
USD/JPY
Weekly gain/loss: + 4 pips
Weekly closing price: 111.30
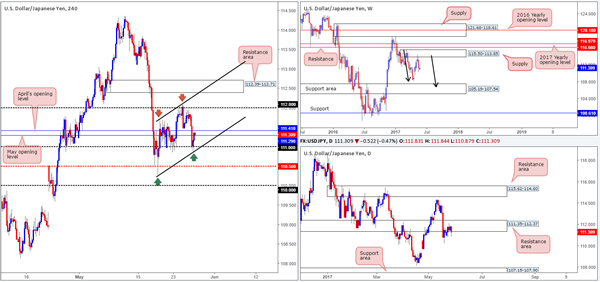
Weekly bears remain in a relatively strong position after pushing aggressively lower from supply registered at 115.50-113.85. We know there’s a lot of ground to cover here, but this move could possibly result in further downside taking shape in the form of a weekly AB=CD correction (see black arrows) that terminates within a weekly support area marked at 105.19-107.54 (stretches all the way back to early 2014).
In conjunction with weekly flow, daily price continues to defend the resistance area penciled in at 111.35-112.37. The next area on the hit list falls in at 107.15-107.90: a support zone that’s glued to the top edge of the said weekly support area.
Casting our lines over to the H4 timeframe, price has been busy forming an ascending channel (110.23/111.72). On Friday, the channel support came into play (tied in nicely with the 111 handle) and marginally bounced price into the closing bell. As of writing though, the bulls are having difficulty breaching May/April’s opening levels at 111.29/111.41. This, of course, could have something to do with where price is currently positioned on the bigger picture.
Our suggestions: Although price has bounced from a confluent H4 channel support, we believe this will be short lived. With that being the case, our team is watching for a H4 close to form below 111 today. Not only would this imply bearish strength from the higher-timeframe structures, it would also clear the runway south down to at least the H4 mid-level support at 110.50. To take advantage of this potential move, one could either sell the breakout or conservatively wait for price to retest 111 as resistance and sell with lower-timeframe confirmation (see the top of this report). We prefer the latter.
Data points to consider: US banks are closed in observance of Memorial Day.
Levels to watch/live orders:
- Buys: Flat (stop loss: N/A).
- Sells: Watch for H4 price to engulf 111 and then look to trade any retest seen thereafter ([waiting for a lower-timeframe signal to form following the retest is advised] stop loss: dependent on where one confirms this level).
USD/CAD:
Weekly gain/loss: – 62 pips
Weekly closing price: 1.3446
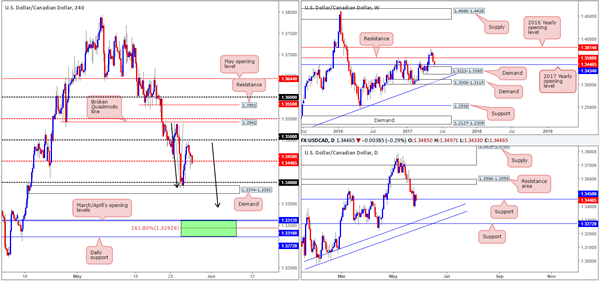
The USD/CAD sustained further losses last week, which saw weekly price whipsaw through the 2017 yearly opening level at 1.3434 and test demand based at 1.3223-1.3395. By and of itself, this could force the unit back up to retest 1.3588 as resistance.
On the other side of the field, daily support at 1.3450 looks as though it’s under pressure. With this level consumed, there’d be little stopping the unit from challenging support at 1.3272, which happens to tie in beautifully with two trendline supports (1.2968/1.3027).
Moving across to the H4 timeframe, the candlesticks remain loitering around a mid-level support drawn from 1.3450. Entering long from this number would be difficult knowing that the said daily support is struggling to hold firm. By the same token, a short would also be just as risky given the weekly structures in play right now.
Our suggestions: Be patient. There is an area which has taken our fancy, but there’s a fair bit of ground to cover before it’s worthy of attention. 1.3272/1.3312: the green shaded zone on the H4 timeframe holds the following structures:
Daily support at 1.3272.
H4 AB=CD (black arrows) 161.8% Fib ext. at 1.3292 taken from the high 1.3540.
1.33 handle.
March/April’s opening levels at 1.3310/1.3312.
Daily trendline support confluence.
As you can see, this zone holds a reasonable amount of confluence. Also of note is this area is seen lodged within the lower limits of the aforementioned weekly demand!
Data points to consider: US banks are closed in observance of Memorial Day.
Levels to watch/live orders:
- Buys: 1.3272/1.3312 ([waiting for a reasonably sized H4 bull candle to form – preferably a full-bodied candle – is advised] stop loss: ideally beyond the candle’s tail).
- Sells: Flat (stop loss: N/A).
USD/CHF:
Weekly gain/loss: + 16 pips
Weekly closing price: 0.9743
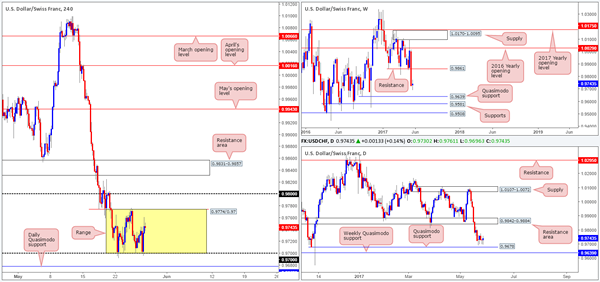
The USD/CHF market was pretty much unchanged last week, consequently forming a weekly indecision candle. From the weekly timeframe, the next downside target can be seen at 0.9639: a Quasimodo support level.
As can be seen from the daily chart, the pair spent the week hovering directly above a Quasimodo support taken from 0.9678, which happens to be located just above the said weekly Quasimodo support.
Since the 22nd May the H4 candles have been entrenched within a range fixed between the 0.97 handle and resistance pegged at 0.9774. Directly above this consolidation sits the 0.98 handle, whereas below we can see the daily Quasimodo support level mentioned above at 0.9678. Personally, shorting from either the top edge of this range or 0.98 is not really something we’d be comfortable with since there’s no higher-timeframe structure supporting these levels.
A fakeout through 0.97 that connects with the aforementioned daily Quasimodo support, however, is a valid long, in our opinion. The reason being is there are likely a truckload of sell stops lingering just below 0.97. These stops, when filled, become sell orders, and thus give the big boys liquidity to buy into from the daily Quasimodo!
Our suggestions: Should price whipsaw through 0.97, test 0.9678, and close back above 0.97, we will look to enter long, targeting the top edge of the H4 range.
Data points to consider: US banks are closed in observance of Memorial Day.
Levels to watch/live orders:
- Buys: 0.97 region ([wait for price to fakeout beyond the 0.97 handle – touch 0.9678 – and then close back above 0.97, before looking to commit to a position] stop loss: ideally beyond the candle’s tail).
- Sells: Flat (stop loss: N/A).
DOW 30
Weekly gain/loss: + 272 points
Weekly closing price: 21082
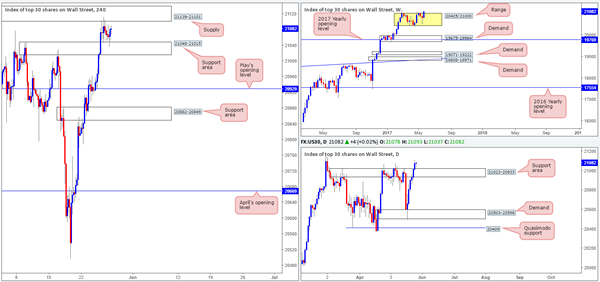
Over the course of last week’s trading, we’ve seen price close above the weekly consolidation fixed around record highs of 21170 between 20425/21000. From this scale, this could very well point toward further buying in the coming week.
The story on the daily chart shows that the unit recently drove through the resistance area at 21022-20933, which should effectively now act as a support area. With this area consumed, we do not see any structure on this timeframe stopping the index from achieving fresh record highs.
Over on the H4 timeframe, nevertheless, the candles are seen confined between a supply zone marked at 21139-21101 and a support area drawn from 21048-21015. Technically speaking, this is the last remaining supply standing in the way of this instrument achieving fresh highs.
Our suggestions: Although the bulls look incredibly determined at this time, entering long expecting price to reach new highs would still be a risk, in our opinion. Waiting for the H4 supply mentioned above at 21139-21101 to be taken out is likely the safer route, before considering hunting for longs. Therefore, until we see a decisive close above this area, our desk will remain patiently waiting on the sidelines.
Data points to consider: US banks are closed in observance of Memorial Day.
Levels to watch/live orders:
- Buys: Watching for H4 price to close above H4 supply at 21139-21101 before looking to long this market.
- Sells: Flat (stop loss: N/A).
GOLD
Weekly gain/loss: + $11.6
Weekly closing price: 1266.9
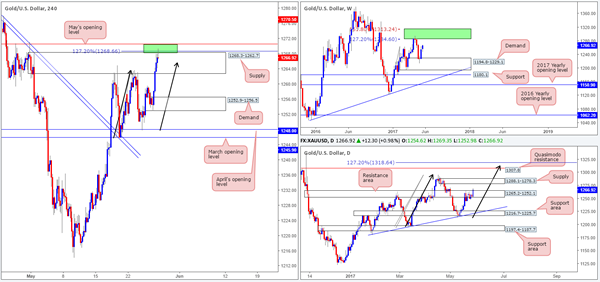
The yellow metal rallied for a second consecutive week after bouncing beautifully from weekly demand coming in at 1194.8-1229.1. This move could encourage further buying into the market and pull the unit back up to the two weekly Fibonacci extensions 161.8/127.2% at 1313.7/1285.2 taken from the low 1188.1 (green zone).
Looking down to the daily timeframe, nonetheless, we can see that the resistance area at 1265.2-1252.1 was slightly breached on Friday. Supposing that the bulls remain in a strong position here, the next upside hurdle on this scale falls in at a supply drawn from 1288.1-1278.3. Also noteworthy on this timeframe is the potential AB=CD bearish pattern that terminates a tad beyond the Quasimodo resistance at 1307.8. But for this pattern to come to fruition, the above noted supply would obviously need to be consumed beforehand.
Swinging over to the H4 timeframe, price is currently finding a pocket of offers from just beyond supply at 1268.3-1262.7. Between the top edge of this zone, the AB=CD 127.2% Fib ext. at 1268.6 (taken from the low 1245.9), and May’s opening level at 1270.5, this small green area is a reasonably confluent sell zone. The only grumble, of course, is the fact that the weekly chart shows room to advance higher and the daily candles just recently took out a resistance zone.
Our suggestions: However tempted we are to short the above noted H4 base, we are going to hold fire. Selling against potential weekly and daily buyers is just too much of a risk for our desk at this point. For that reason, we’ll remain on the sidelines and reassess going into tomorrow’s open.
Levels to watch/live orders:
- Buys: Flat (stop loss: N/A).
- Sells: Flat (stop loss: N/A).


