
The EUR/USD currency pair
Technical indicators of the currency pair:
Prev Open: 1.13892
Open: 1.13694
% chg. over the last day: -0.10
Day’s range: 1.13651 – 1.13908
52 wk range: 1.1214 – 1.2557
EUR has stabilized. The EUR/USD quotes are moving sideways. The key support and resistance levels are 1.13700 and 1.14000. The investors are evaluating the stream of the geopolitical news. The US President Donald Trump and the leader of the PRK Kim Jeong Un could not reach an aggreement on the denuclearization of Korea on the summit in Vietnam. The European comision is worried about the Italian debt. The attention of the market participants is on the preliminary data on the US GDP. You should open positions from the key levels.
The Economic News Feed for 28.02.2019:
GDP report (US) – 15:30 (GMT+2:00);
Number of the primary requests for unemployment benefits (EU) – 15:30 (GMT+2:00);
Also, keep an eye on the comments made by the FOMC representatives.
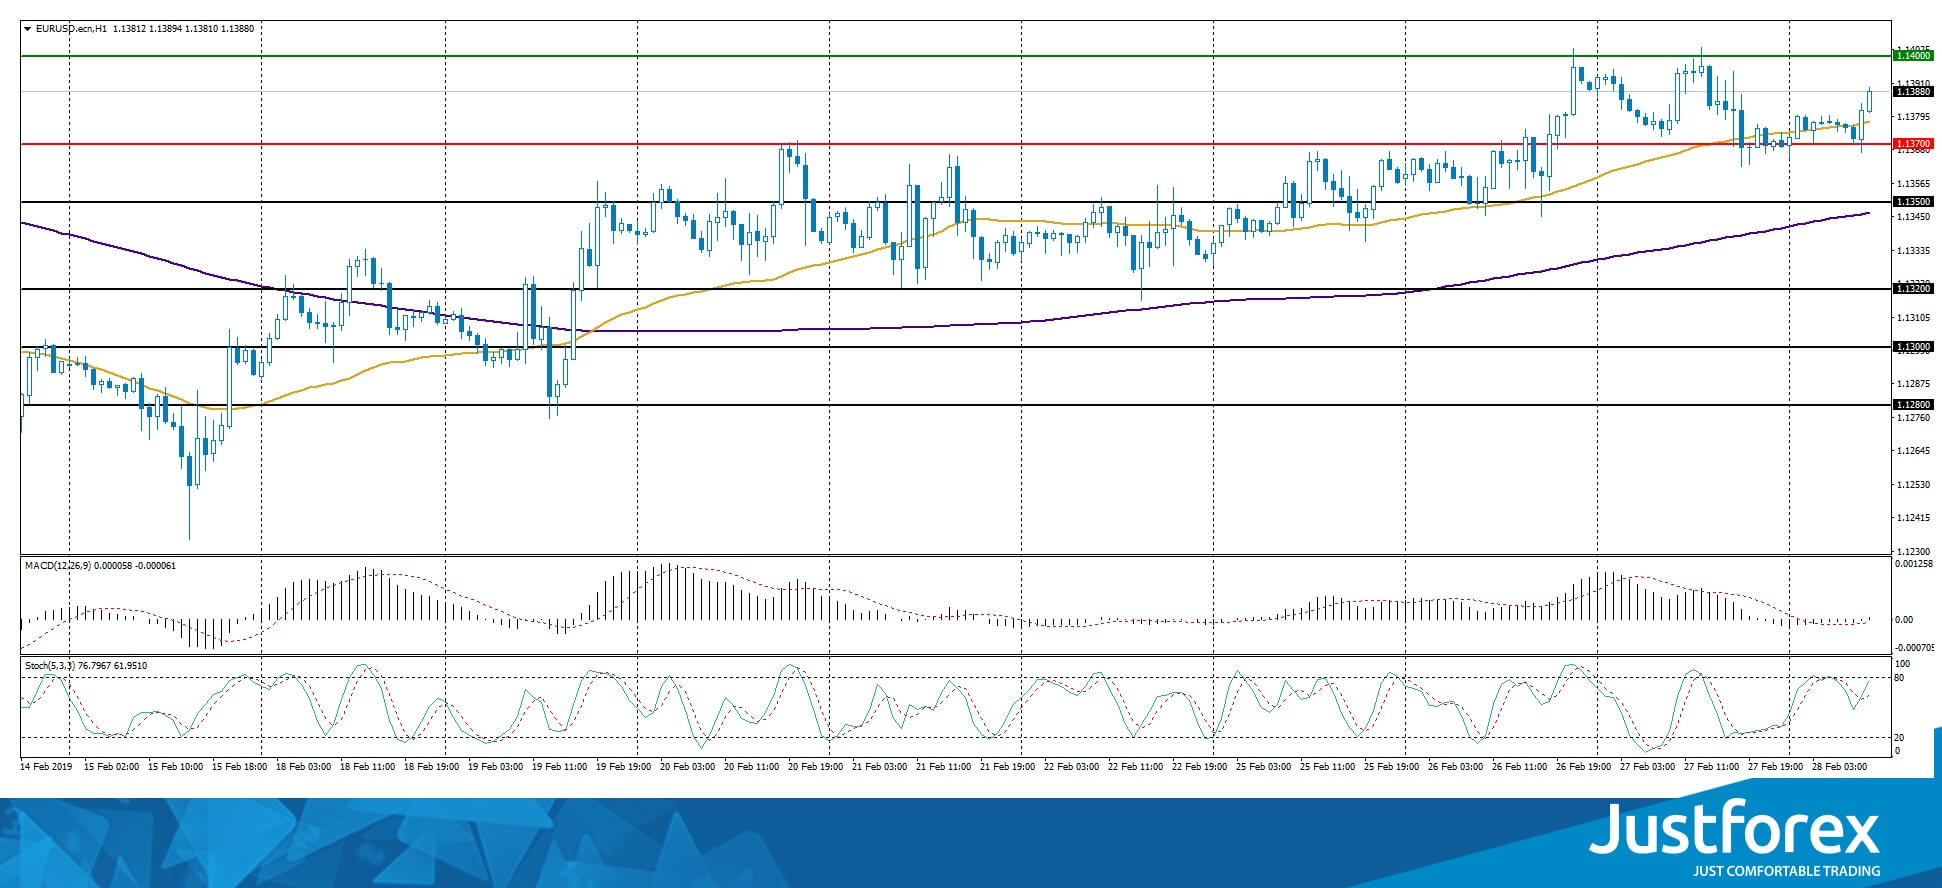
The indicators do not provide precise signals, the price has crossed 50 MA.
The MACD histogram is close to 0.
The Stochastic Oscillator is in the neutral zone, the %K line is above %D line, which points to the bullish mood.
Trading recommendations
Support levels: 1.13700, 1.13500, 1.13200
Resistance levels: 1.14000, 1.14500
If the price fixes above the round 1.14000, expect the quotes to grow toward 1.14300-1.14500.
Alternatively, the quotes can correct toward 1.13500-1.13300.
The GBP/USD currency pair
Technical indicators of the currency pair:
Prev Open: 1.32519
Open: 1.33068
% chg. over the last day: +0.50
Day’s range: 1.32730 – 1.33193
52 wk range: 1.2438 – 1.4378
GBP/USD keeps showing a positive trend. Yesterday the quotes grew by 60 points. The pound teached the 1.33 USD. Earlier Theresa May offered the British lawmakers to offer for posponing Brexit, in order to prevent a chaotical exit without an aggreement. Right now the quotes are consolidating around 1.32750-1.33450. You should open positions from these levels.
The Economic News Feed for 28.02.2019 is calm.
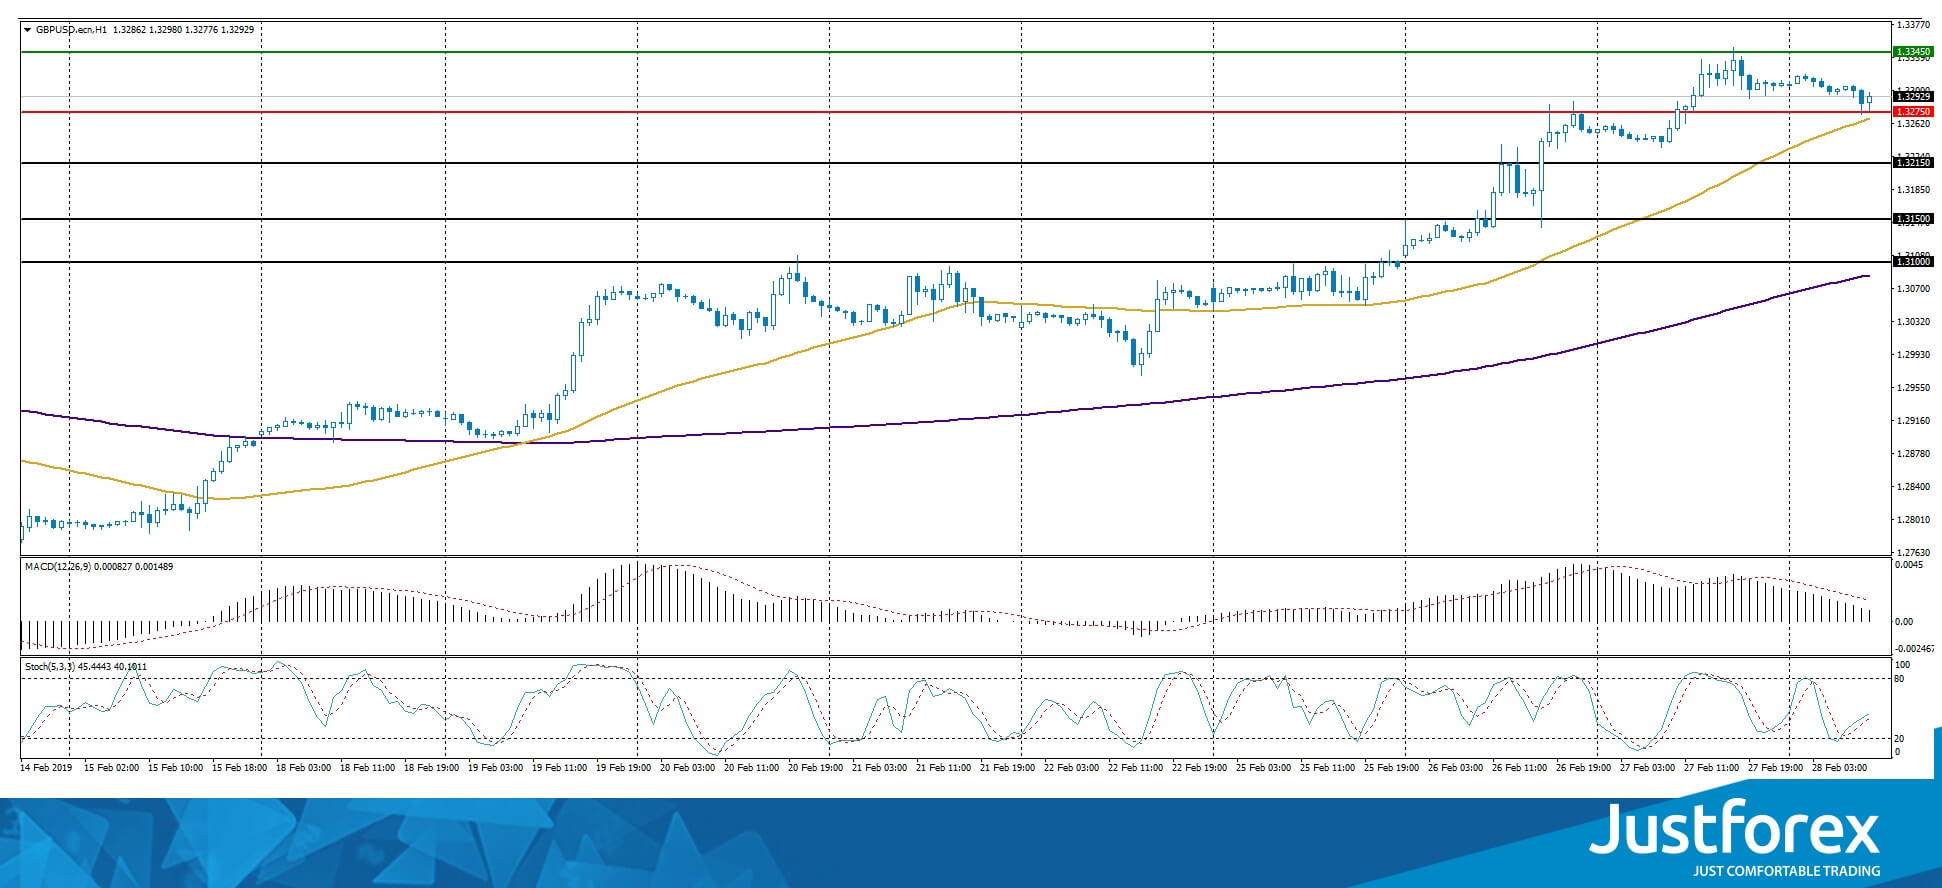
The price fixed above 50 MA and 200 MA which points to the power of the buyers.
The MACD histogram is in the positive zone, but below the signal line, which gives a weak signal to buy GBP/USD.
The Stochastic Oscillator is in the neutral zone, the %K line is above the %D line, which points to the bullish mood.
Trading recommendations
Support levels: 1.32750, 1.32150, 1.31500
Resistance levels: 1.33450, 1.34000
If the price fixes above 1.33450, expect the quotes to grow toward 1.34000.
Alternatively, the quotes can correct toward 1.32150-1.31800.
The USD/CAD currency pair
Technical indicators of the currency pair:
Prev Open: 1.31657
Open: 1.31543
% chg. over the last day: -0.20
Day’s range: 1.31410 – 1.31762
52 wk range: 1.2248 – 1.3664
USD/CAD is showing an ambiguous technical picture. The trading instrument is moving sideways. The local support and resistance levels are 1.31500 and 1.31850. The financial market participants are waiting for additional drivers. Keep an eye on the US GDP. You should open positions from the key levels.
The Economic News Feed for 28.02.2019 is calm.
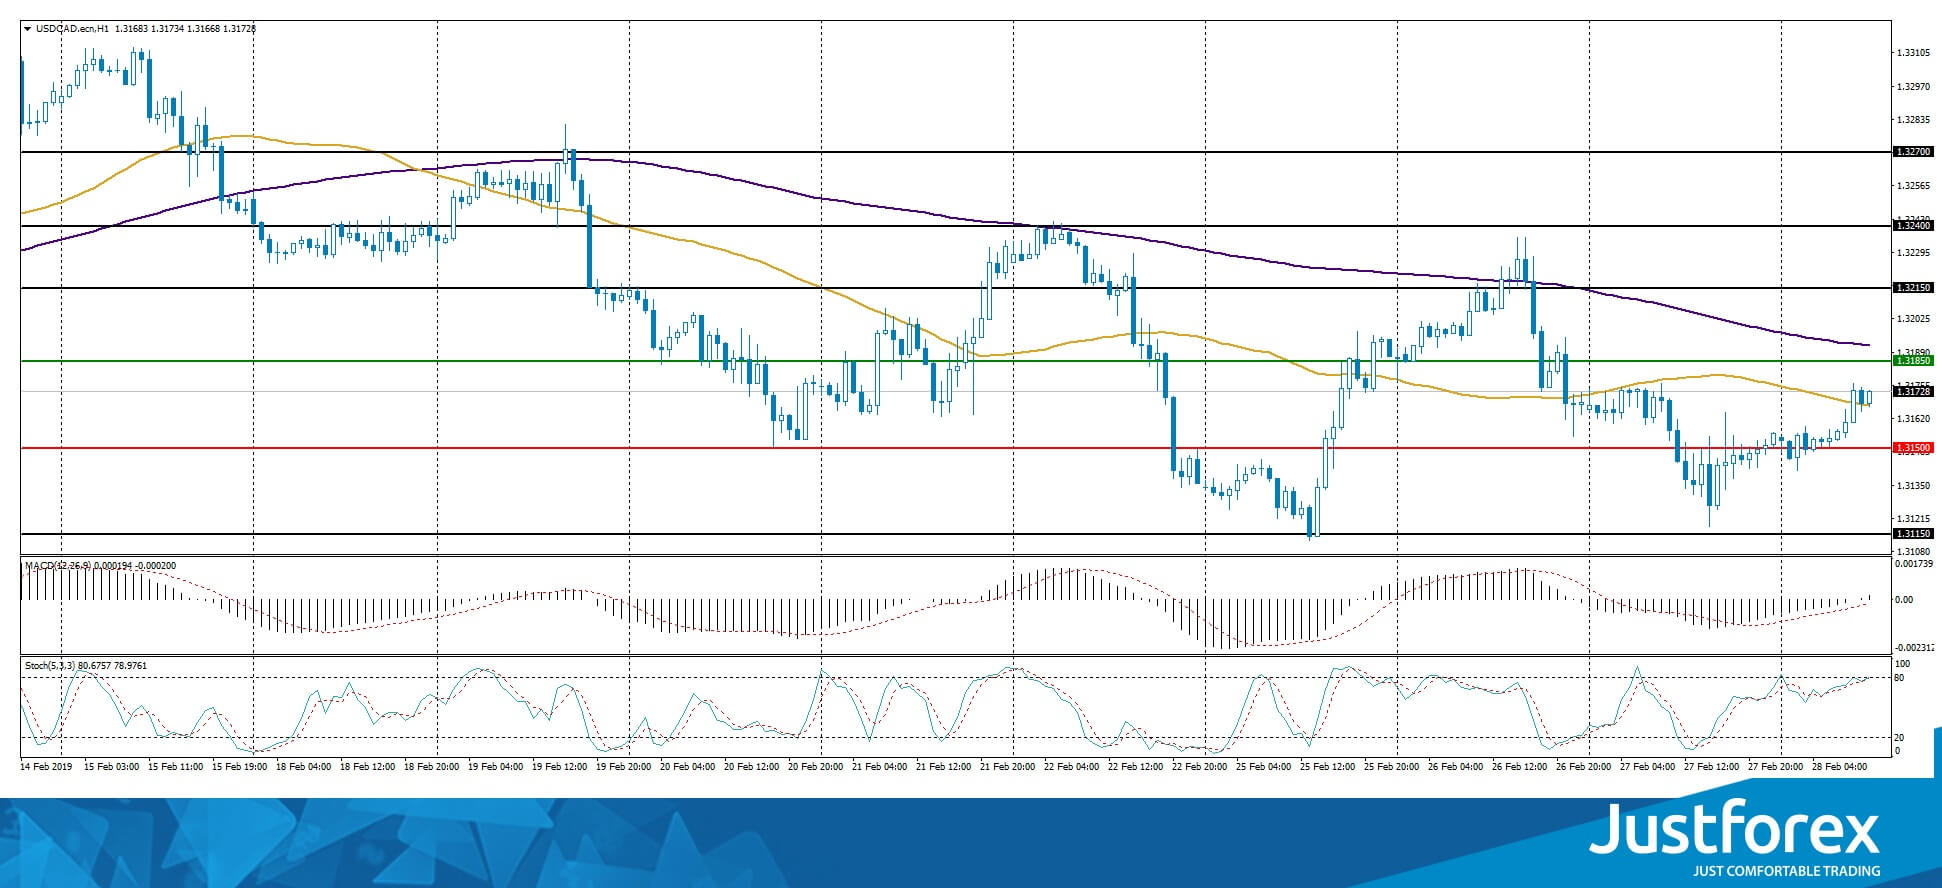
The indicators do not provide precise signals, the price has crossed 50 MA.
The MACD histogram is in the positive zone, which gives a signal to buy USD/CAD.
The Stochastic Oscillator is in the overbought zone, the %K line is crossing the %D line. There are no signals at the moment.
Trading recommendations
Support levels: 1.31500, 1.31150, 1.31000
Resistance levels: 1.31850, 1.32150, 1.32400
If the price fixes below 1.31500, expect the quotes to fall toward the round 1.31000.
Alternatively, the quotes can grow toward 1.32150-1.32400.
The USD/JPY currency pair
Technical indicators of the currency pair:
Prev Open: 110.568
Open: 110.984
% chg. over the last day: +0.26
Day’s range: 110.661 – 110.997
52 wk range: 104.56 – 114.56
From the beginning of the week, USD/JPY is very active. There is no single definitive trend. Right now there is no safe haven currency. The local support and resistance levels are 110.650 and 110.850. You should open positions from these levels. Keep an eye on the economic reports and the bond dynamics.
During the Asian trading session, Japan published weak reports on the Japanese production volume and retail sales.
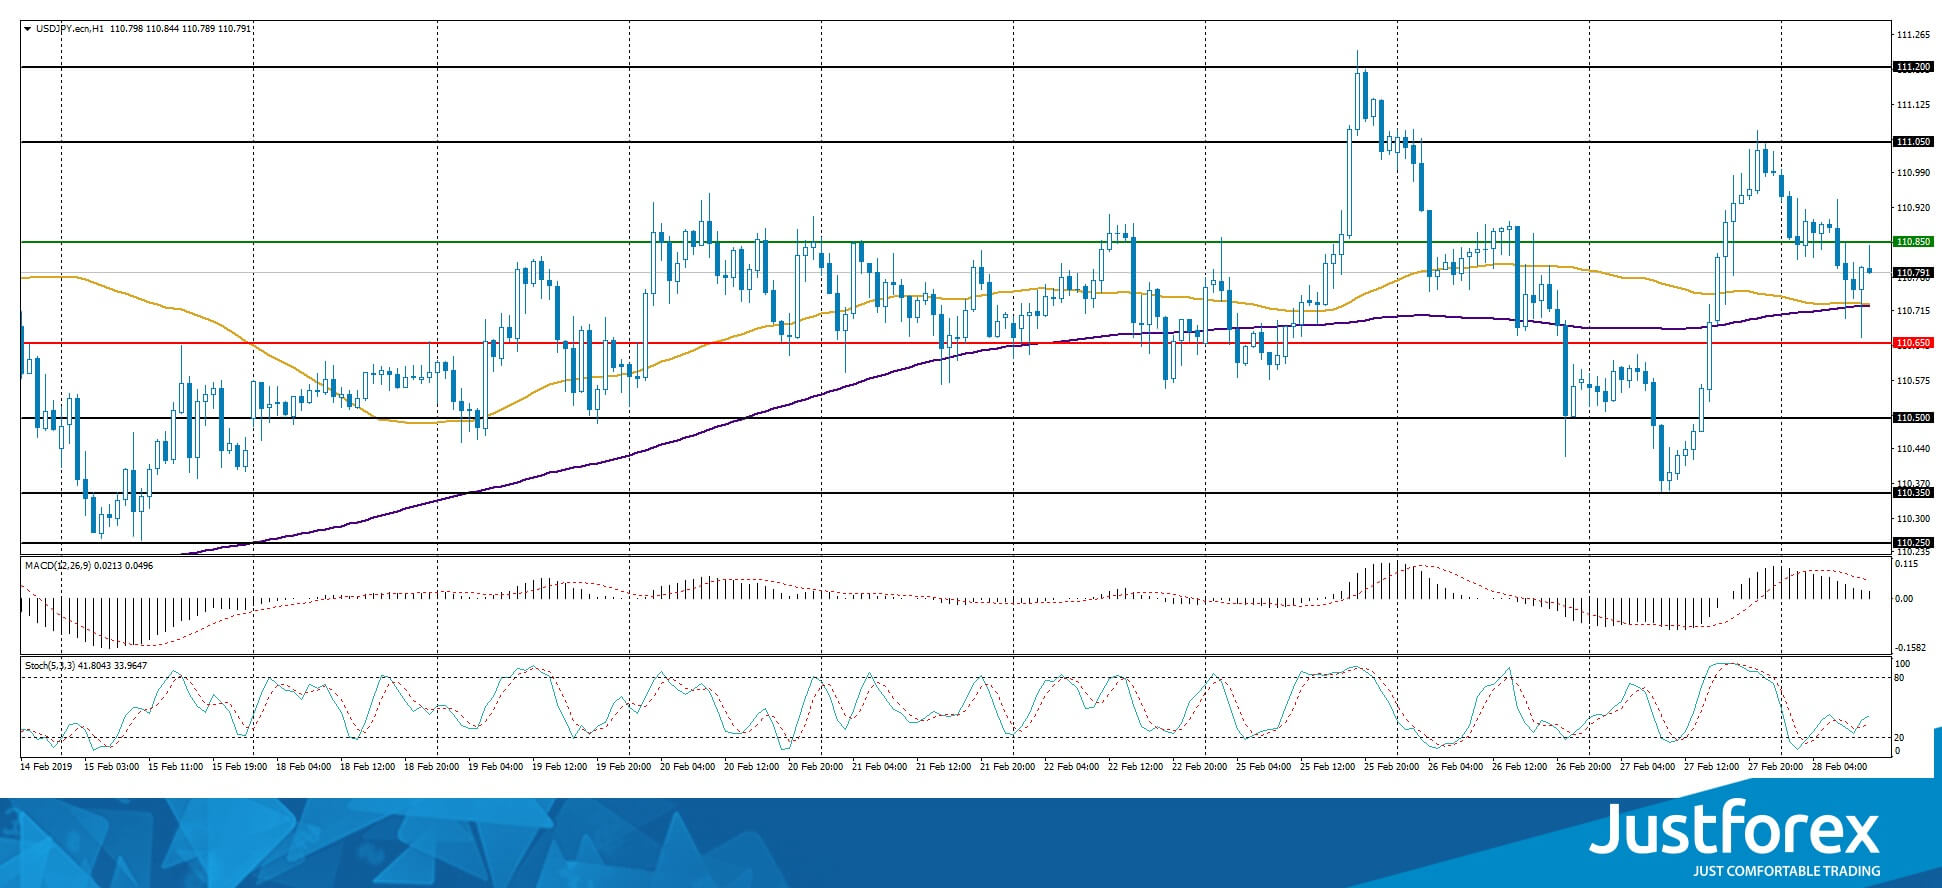
The indicators do not provide precise data, 50 MA has crossed 200 MA.
The MACD histogram is in the positive zone but above the signal line, which gives a weak signal to buy USD/JPY.
The Stochastic Oscillator is in the neutral zone, the %K line is above the %D line, which points to the bullish mood.
Trading recommendations
Support levels: 110.650, 110.500, 110.350
Resistance levels: 110.850, 111.050, 111.200
If the price fixes below 110.650, expect the quotes to fall toward 110.400-110.250.
Alternatively, the qtuoes can grow toward 111.100-111.300.


