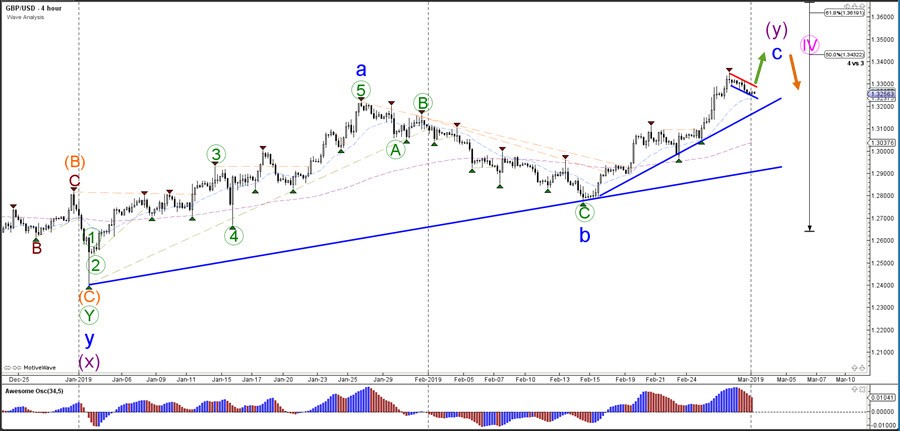
A GBP/USD bullish breakout and bounce at the 50% Fib could complete the wave C (blue) of wave Y (purple) of wave 4 (pink). A bullish break above the 61.8% Fib, however, could indicate a different wave pattern than the expected wave 4 (pink) correction. A break below the support trend lines (blue) confirms the end of wave 4 (pink) and the start of a wave 5.
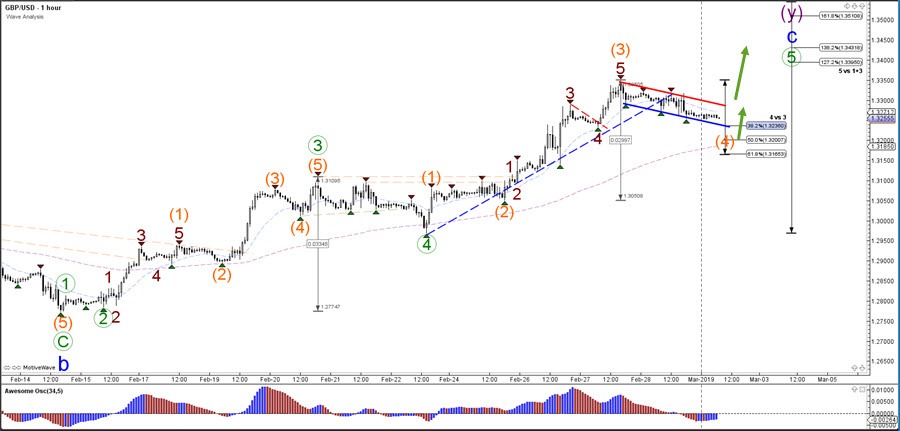
The GBP/USD bullish breakout above the resistance trend line (dotted red) confirmed a wave 5 (brown) of wave 3 (orange). Now price seems to be building a bull flag continuation chart pattern as price is moving lower slowly and choppily. A bullish bounce at the Fibonacci levels of wave 4 vs 3 (orange) and a break above the next trend line (red) could confirm the wave 4 (orange) retracement and the start of a 5th wave. A break below the 61.8% Fib indicates a different wave scenario.