EUR/USD
It was a dull Monday with holidays in most major markets keeping activity to the minimum across the FX board. China, the UK and the US, all remained closed at the beginning of the week. The only relevant event of the day was ECB’s Draghi’s testimony before the European Parliament, which added nothing new to what the market already knew. Draghi stressed the need for further monetary support, as despite the downside risks to the economic outlook have been diminishing, it’s too early to retrieve it. The major issue, according to ECB’s head is that underlying inflation has remained subdued as well as wage growth, insufficient to support a durable and self-sustaining convergence of inflation toward the medium-term objective.
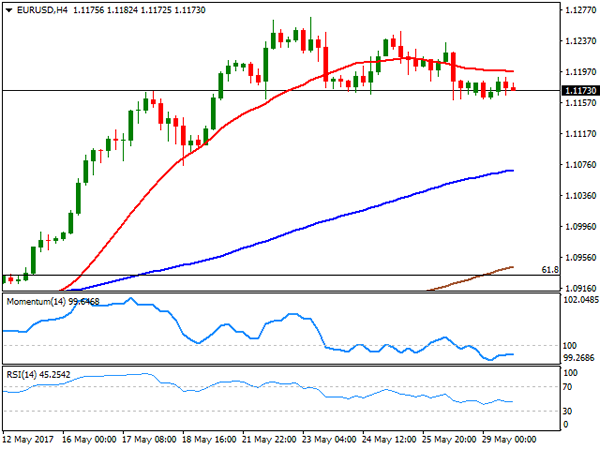
The EUR/USD pair traded in the 1.1160/80 region all day long, with investors awaiting fresh clues, in the form of US and German preliminary May´s inflation, both scheduled to be released this Tuesday, alongside with EU latest confidence surveys. The technical picture in the short term favors a downward extension, although it will remain corrective due to ongoing dollar’s weakness, unless the pair returns to territory sub-1.1000. In the 4 hours chart, technical readings present a neutral-to-bearish stance, with the price contained below a horizontal 20 SMA, and technical indicators heading marginally lower within negative territory.
Support levels: 1.1160 1.1120 1.1080
Resistance levels: 1.1220 1.1260 1.1300
USD/JPY
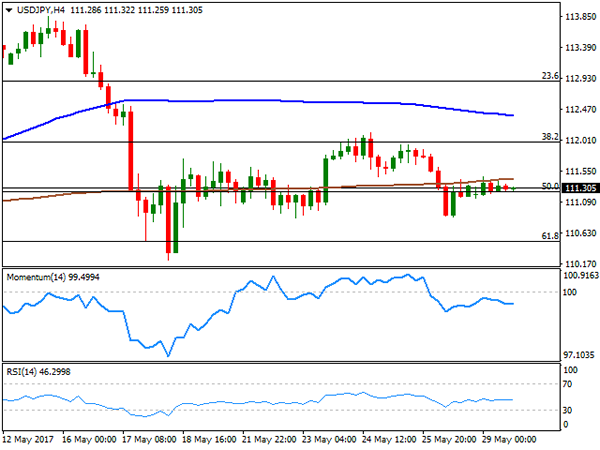
The USD/JPY pair was unable to move this Monday, holding around its Friday’s close of 111.33 for the past 24 hours, as multiple holidays across the world kept the most relevant markets closed. China will extend its holidays into this Tuesday, but the rest of the Asian markets will be active. Japan will release its April unemployment and retail sales data, expected to have improved modestly from March figures. Better-than-expected figures should favor additional gains in the JPY, as firmer macroeconomic data will support the beginning of the end for easing in the country. Still, and in the short term, yields will likely remain as the main motor. From a technical point of view, the pair has made little progress, comfortably consolidating around the 50% retracement of its latest bullish run and below its moving averages in the 4 hours chart, in where technical indicators head marginally lower within bearish territory, lacking momentum amid the absence of volume. A strong support comes at 110.85, with a break below it favoring a stronger slide towards the 110.00 region.
Support levels: 110.85 110.50 110.10
Resistance levels: 111.65 112.00 112.45
GBP/USD
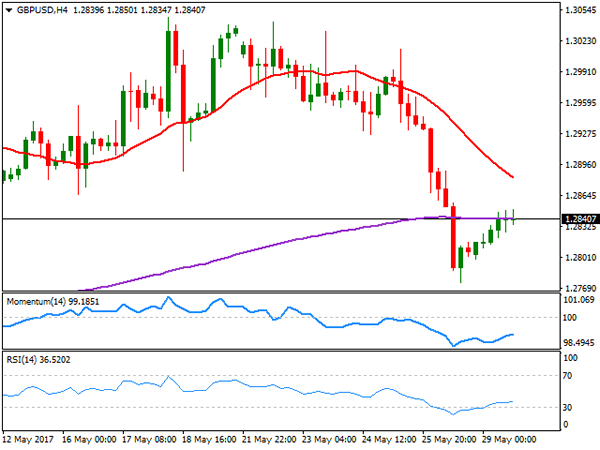
The GBP/USD pair recovered up to 1.2850 this Monday, settling a few pips below it, amid continued dollar’s weakness, despite thin trading conditions. There were no macroeconomic news coming from the UK, although PM May confirmed that Brexit negotiations will start next June 19th, urging voters to give her the support she needs in the upcoming national election. The announcement came after a survey poll led by The Independent showed that most voters want to know more about the Brexit plan before the election. Indeed, the Pound will be all about election and Brexit during the next couple of weeks, with polls leading the way, as both currencies are equally weak these days. From a technical point of view, the risk turned towards the downside after the bearish breakout of 1.2900, although there’s still a critical support in the way towards 1.2500, the 1.2756 low set on April 21st, as it’s the lowest since PM May announced the election. Technical readings in the 4 hours chart confirm the negative bias, as technical indicators have barely corrected oversold conditions before losing upward strength, whilst the price keeps developing below a bearish 20 SMA, now providing resistance around 1.2880.
Support levels: 1.2790 1.2765 1.2730
Resistance levels: 1.2840 1.2885 1.2920
GOLD
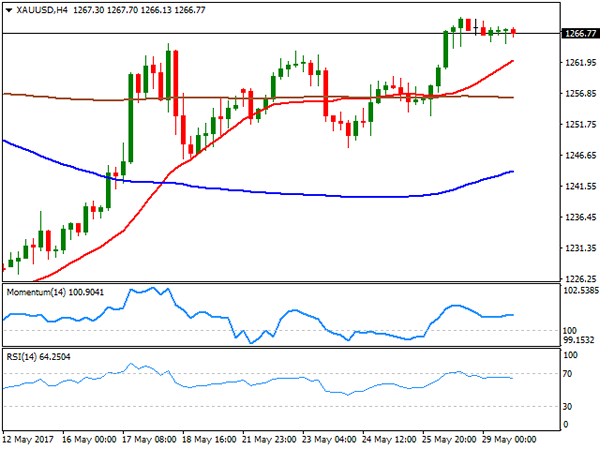
Spot gold held near the three-week high set last Friday, heading into the Asian session barely below Friday’s close, now around $1,266.70 a troy ounce. Political jitters and physical demand should back gold prices during the upcoming sessions, as during the weekend, North Korea issued another missile test that landed in the Sea of Japan, whilst Asian buyers will boost demand ahead of the wedding season. Also, the US will release its PCE index this Tuesday, Fed’s favorite inflation measure, and higher than expected readings may cap advances on mounting speculation about a rate hike this month. Technically, the daily chart shows that the price holds well above their moving averages, whilst technical indicators have lost their upward strength, consolidating near overbought levels. In the 4 hours chart, the technical picture is neutral-to-bullish, as the price is also standing above its moving averages, with the 20 SMA heading north and providing an immediate support at 1,262.25, and technical indicators heading nowhere well above their mid-lines, reflecting the current quietness rather than suggesting upward exhaustion.
Support levels: 1,262.25 1,254.60 1,245.20
Resistance levels: 1,272.90 1,283.10 1,290.00
WTI CRUDE OIL
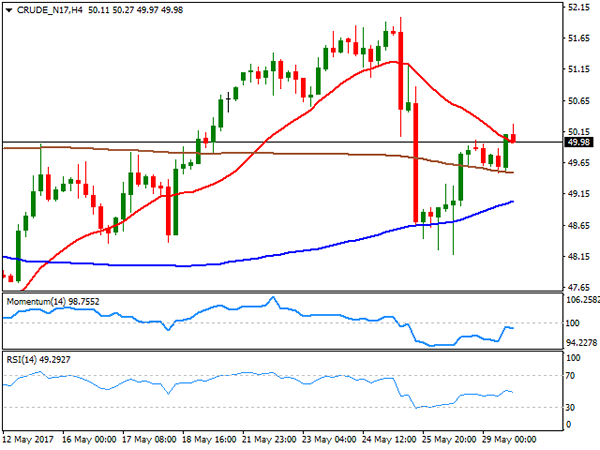
Oil prices advanced modestly this Monday, with West Texas Intermediate crude futures flirting with the 50.00 figure by the end of the day. The commodity traded as high as $50.27 a barrel with investors still cautious after a disappointing OPEC’s announcement and another sign of US rising production, after the Baker Hughes report showed that the country keeps increasing drilling. Technically, the daily chart shows that the price remains below its 100 and 200 DMAs, both converging around 51.00, but above a bullish 20 DMA, whilst technical indicators hold within positive territory, although without directional strength. In the 4 hours chart, the price is now struggling around a bearish 20 SMA, whilst technical indicators have faltered around their mid-lines, now heading modestly lower within neutral territory, indicating that buying interest is still limited. An advance beyond 50.50, however, will likely indicate additional gains for this Tuesday.
Support levels: 49.40 48.70 48.10
Resistance levels: 50.50 51.20 51.85
DJIA
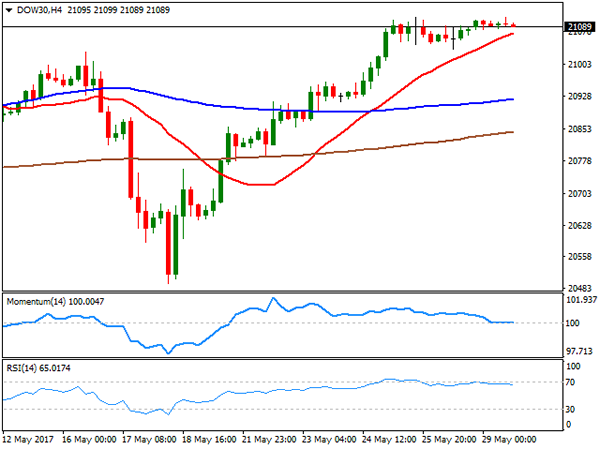
Wall Street was closed this Monday, posting, however, a modest advance in electronic trading. The Dow Jones Industrial Average closed on Friday at 21,080.28, peaked at 21,111 this Monday, and currently stands around 21,090 ahead of the Asian opening. The index remains near record highs, albeit political jitters may take their toll over US equities this Tuesday, with the banking sector at risk, after plummeting in Italy on speculation of a call for early election, alongside with rising tensions surrounding North Korea. The technical picture for the Dow remains unchanged from previous update, generally bullish, despite indicators have turned flat within positive territory, amid the lack of volume at the beginning of the week. In the 4 hours chart, the index holds above a bullish 20 SMA, while the Momentum indicator has turned flat around its 100 level, as the RSI indicator holds near overbought readings. The mentioned 20 SMA stands at 21,075, offering an immediate support, although it will take a downward acceleration though the 21,00 figure to confirm a bearish extension for the upcoming sessions.
Support levels: 21,075 21,048 21,003
Resistance levels: 21,112 21,169 21,200
FTSE100
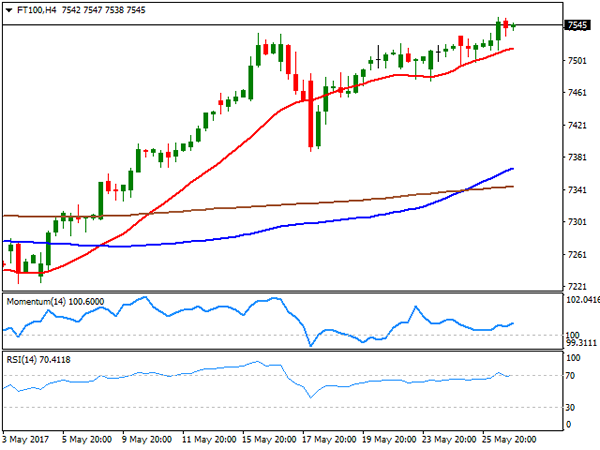
The London market remained closed this Monday, with the FTSE 100 latest registered close at 7,545, right below an intraday all-time high of 7,554 set on Friday. The Footsie advanced for four consecutive weeks, backed partially by latest Pound’s weakness, as most of the companies listed generate revenues abroad that get pumped up on a fragile local currency. In fact, the index’s latest rally can be attributed to speculation that the Pound will weaken further during the upcoming months and following the Brexit. Upcoming short term behavior, however, will depend on how Asian shares develop, particularly those related to commodities. In the meantime, the technical picture is bullish, as in the daily chart, the index remains far above all of its moving averages, whilst technical indicators are aiming back higher after a modest downward correction, holding near overbought levels. In the shorter term, the 4 hours chart the risk is also towards the upside, as the Momentum barely aims higher within neutral territory, whilst the RSI indicator corrected partially overbought readings, but pared losses around 70. In this last time frame, a bullish 20 SMA heads north below the current level, offering a dynamic support around 7,515.
Support levels: 7,515 7,490 7,455
Resistance levels: 7,554 7,590 7,620
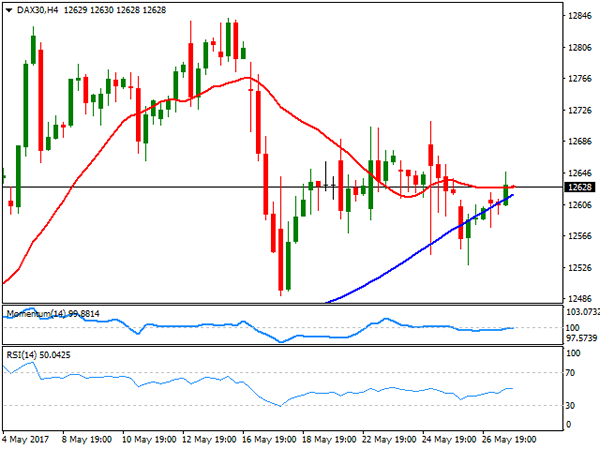
DAX
The German DAX added 26 points or 0.21% this Monday, closing at 12,628.95, in a lackluster trading day, amid holidays in the UK and the US. Most members closed up, although the banking sector came under pressure all through the region, dragged lower by Italian ones that plunged on talks over a possible early election in the country. Within the DAX, Muenchener was the best performer, up 0.97%, while Bayerische followed, ending up 0.85%. Vonovia was the worst performer shedding 0.97%, followed by Deutsche Bank that closed 0.61% lower. From a technical point of view, the index retains the neutral bias seen on previous updates, holding a few points below its 20 DMA, but far above bullish 100 and 200 SMAs, whilst technical indicators head nowhere around their mid-lines. In the shorter term, and according to the 4 hours chart, the benchmark is also neutral, with the Momentum stuck around its 100 level, the RSI hovering around its mod-line and the index converging with a horizontal 20 SMA.
Support levels: 12,591 12,542 12,490
Resistance levels: 12,631 12,675 12,729