
In this blog, we take a look at US Dollar Index correlation with USDPLN and we also look at the updated Elliott wave charts of USDPLN which have been working very nicely since we highlighted the bullish sequence in USDPLN back in February 2019. USDPLN had broken above the October 2018 peak and was showing 5 swings up from 9.26.2018 low which created a 5 swings bullish Elliott wave sequence and called for more upside after a pull back. We made it clear that our strategy was to look for buying opportunities in the dips.
Right after we published our blog, US Dollar started pulling back against PLN and retraced 50% of the rally from 1.31.2019 low. It also reached 100% Fibonacci extension of ((a))-((b)) down from the peak before bouncing again. Let’s take a look at the updated Elliott wave charts of USDPLN forex pair.
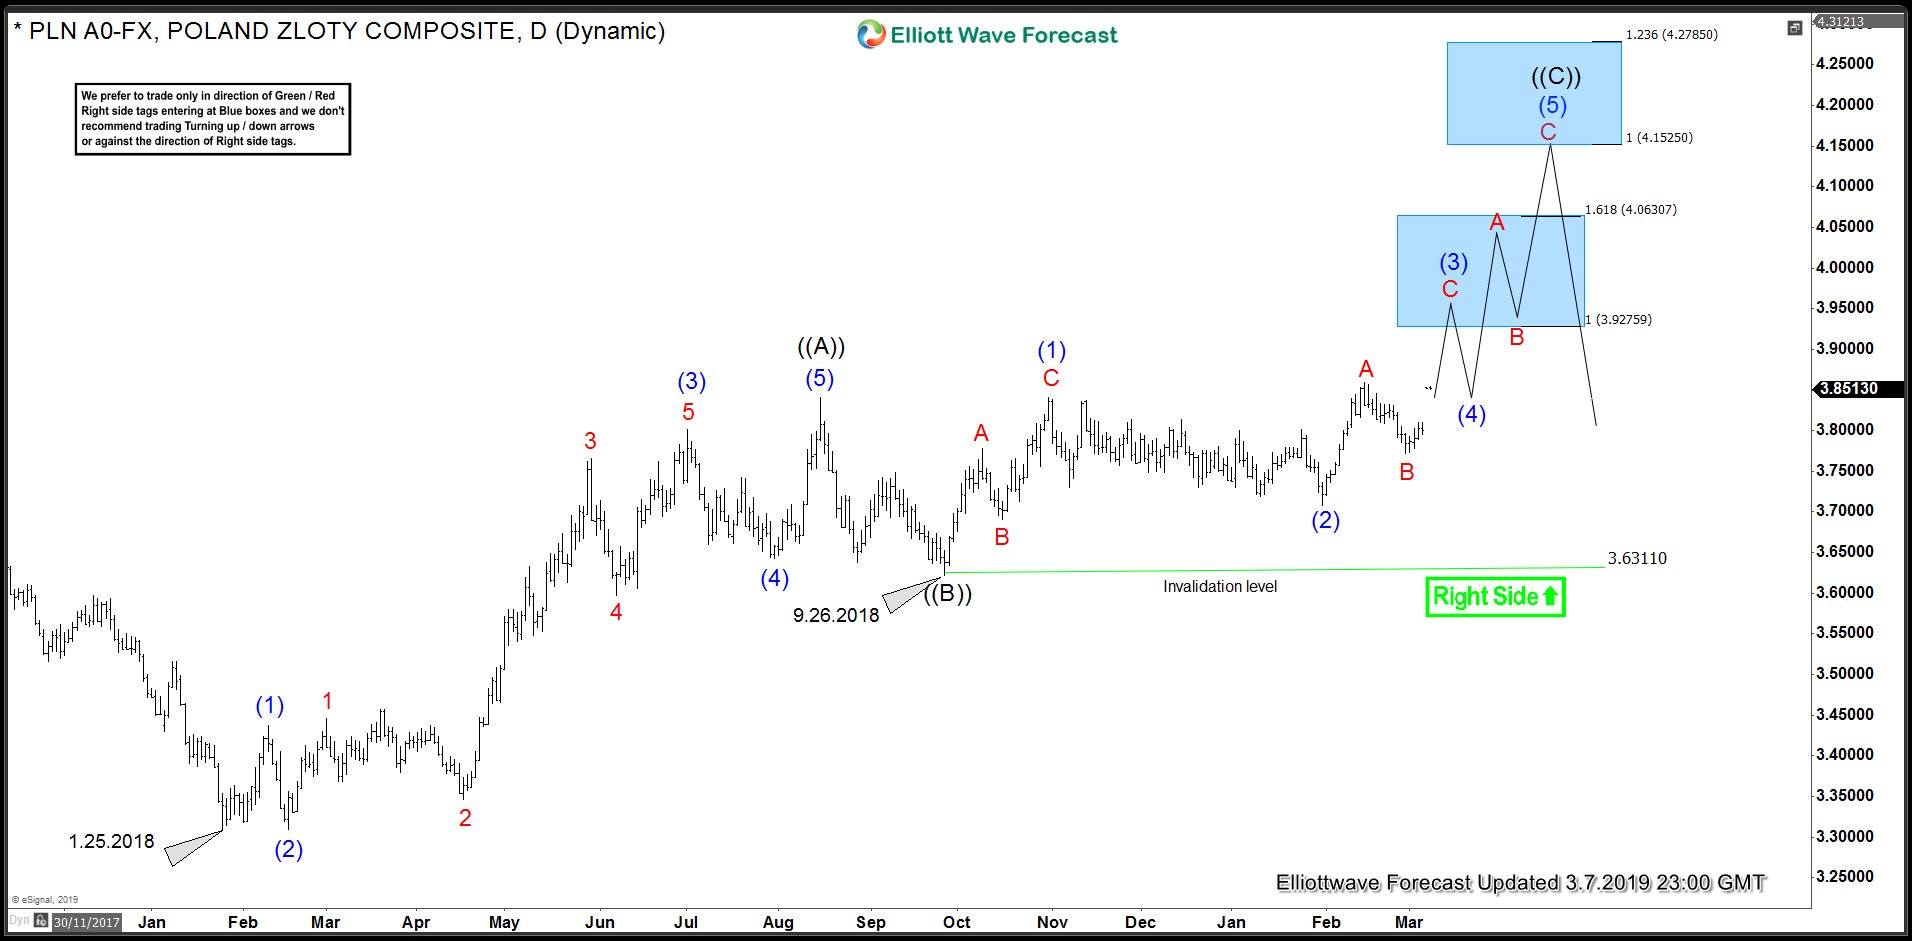
US Dollar (USDPLN) Daily Elliott Wave Analysis 3.7.2019
USDPLN closed just below February 14 peak, rally from February 28 low appears impulsive as we will see on the 1 hour charts below which makes the break higher a very likely scenario. Break above February 14 peak exposes 3.9275 area which is 100% Fibonacci extension of blue (1)-(2) cycles where as 100% Fibonacci extension of red A-B lies just below at 3.92.
USDPLN 1 Hour Elliott Wave Analysis 3.7.2019
Rally from February 28 low appears to be unfolding as an Elliott wave impulse and it could be counted in two different ways as shown below. Once February 14 at 3.8594 is broken, expect buyers to appear again in the pull backs in 3, 7 or 11 swings for extension higher. Chart below shows the pair to be already within wave (iii) of ((iii)) which means pull backs would be shallow going forward until we reach 3.92 target area. Wave (iv) blue and wave ((iv)) black pull back later should offer short-term buying opportunities under this scenario.
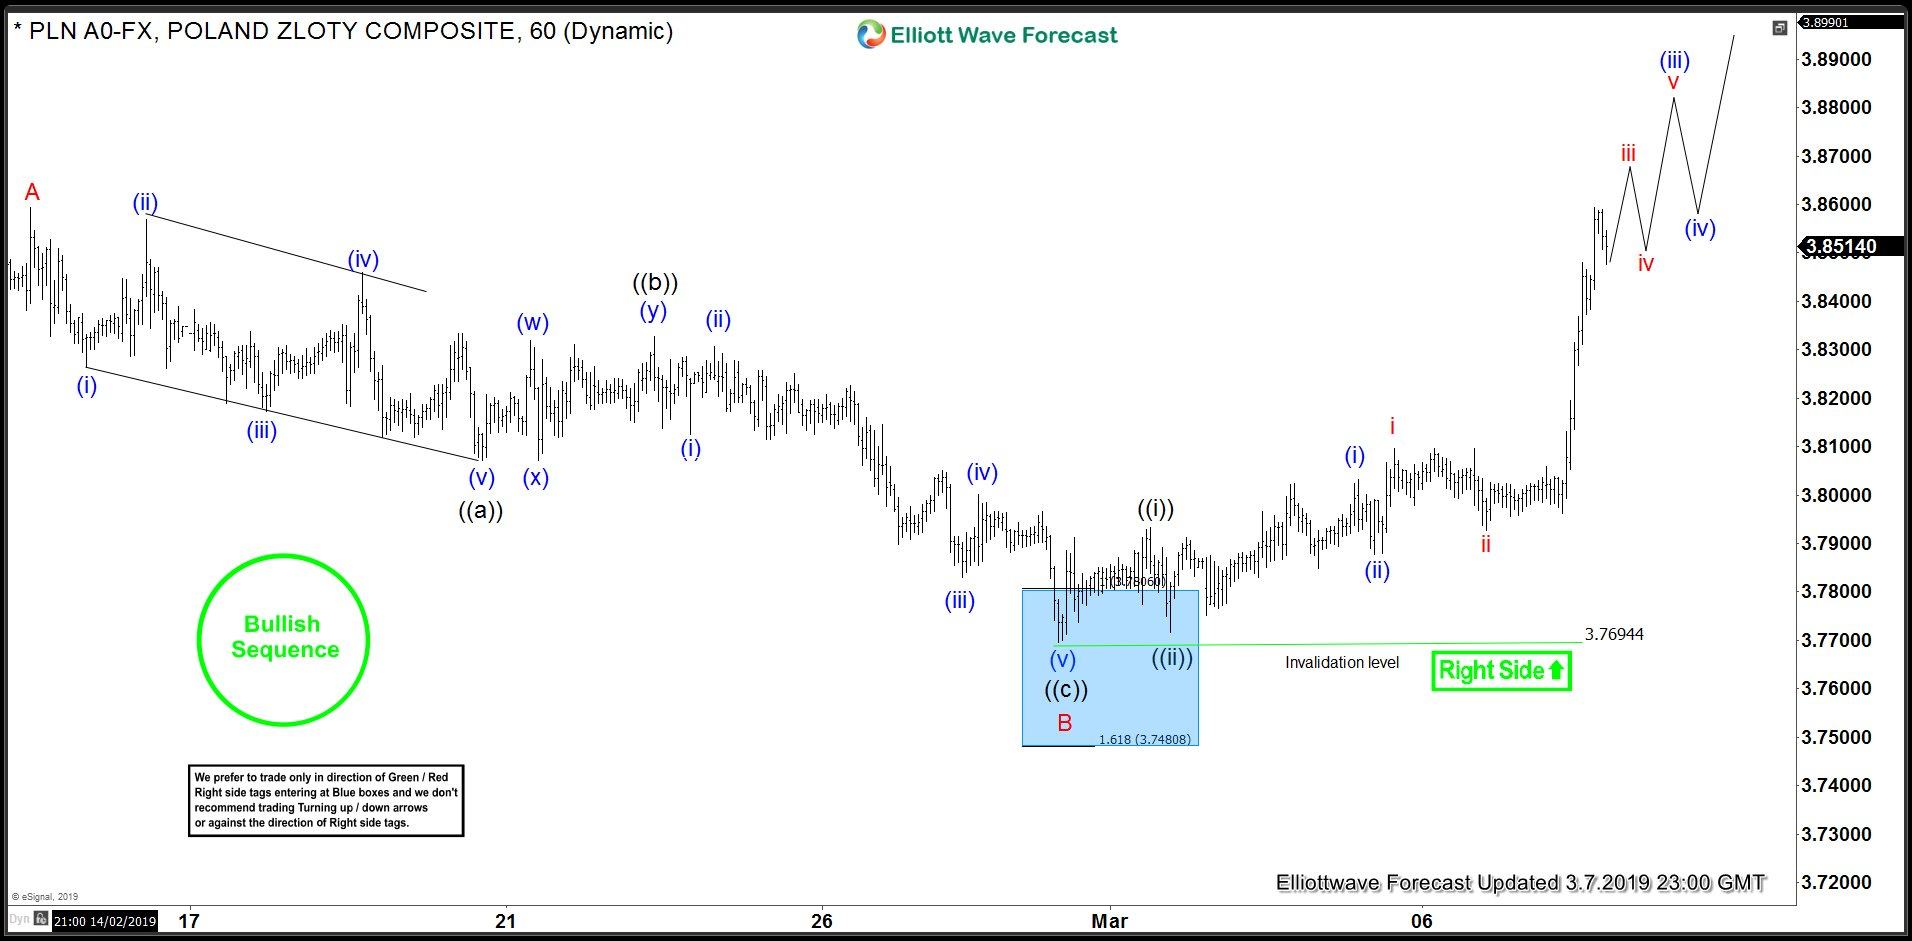
This scenario suggests we are still in wave ((i)) and calls for a relatively larger pull back in wave ((ii)) once wave ((i)) completes before pair continues higher in wave ((iii)) of C. Wave ((ii)) pull back should see buyers appear in the pull backs after 3, 7 or 11 swings.


