
EUR/USD
The EUR/USD pair ended day as it started, trading a handful of pips below the 1.1200 level, but intraday moves said much about were speculative interest is standing on these days. Headlines suggesting that Greece may default again spurred risk aversion during Asian trading hours, supporting temporarily the greenback, although once London opened, selling of the American currency resumed. What prevented the pair from appreciating further was a downward surprise coming from European data, as consumer confidence in the region fell 3.3 points in May, matching expectations, whilst the Economic sentiment indicator fell to 109.2 from previous 109.7, and against the 110.0 expected. Also, preliminary May German inflation came below previous and expected. Headline CPI dropped to 1.5% YoY from 2.0% YoY in April, while in the month, German prices decreased by 0.2%.
In the US, things were not better, as April spending and income figures came in line with market’s forecasts, while the CB consumer confidence index fell for a second consecutive month, down to 117.9 from a previous 119.4, all of which maintained the dollar under pressure, prompting additional selling.
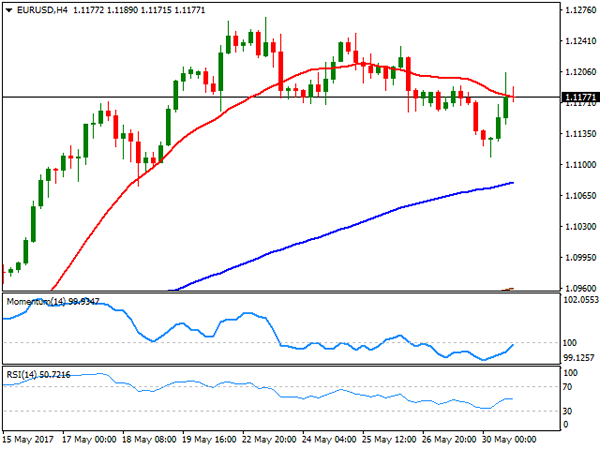
Technically, the pair remains unable to surpass the 1.1200 figure, although chances of a downward move are quite limited, as it’s clear that the market is far from interested in buying the greenback. Not yet confirmed, a downward corrective movement may have been completed with Tuesday’s slide down to 1.1109. In the 4 hours chart, the price is now battling around its 20 SMA that lost its bearish strength, whilst technical indicator have bounced from near oversold territory, now struggling around their mid-lines. The pair needs now to advance beyond 1.1220, the immediate resistance to be able to advance further, with scope to extend its rally beyond current yearly high and up to 1.1300.
Support levels: 1.1160 1.1120 1.1080
Resistance levels: 1.1220 1.1260 1.1300
USD/JPY
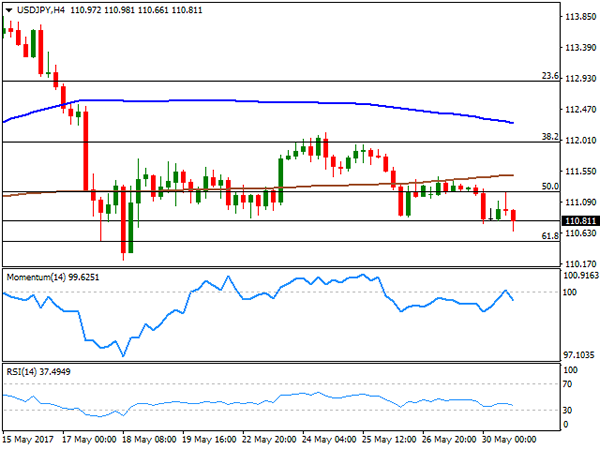
The USD/JPY pair closed the day below the 111.00 mark for the first time in two weeks, with the yen boosted at the beginning of the day by risk aversion, and comments from Yamaguchi, the Komeito Party leader, who said that the next Bank of Japan´s governor should avoid dramatic changes. Kuroda’s term ends on April 2018. Additionally, US Treasury yields edged lower as US inflation data spurred concerns over Fed’s ability to raise rates as soon as this June. Trading around 110.80, the pair is slowly gaining bearish traction, as intraday technical readings favor additional declines. In the 4 hours chart, the price moved further below its 100 and 200 SMAs that are still lacking directional strength, whilst the Momentum indicator turned south after faltering around their mid-lines, whilst the RSI indicator also turned south, now standing around 36. The pair has an immediate support at 110.50, the 61.8% retracement of its latest bullish run, the level to break to confirm a new leg south.
Support levels: 110.50 110.10 109.75
Resistance levels: 111.10 111.65 112.05
GBP/USD
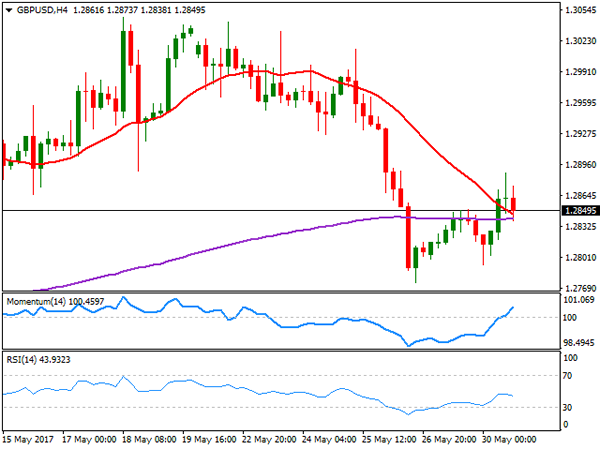
The GBP/USD pair advanced for a second consecutive day, posting, however, some modest gains, as both currencies are among the weakest in the G10 bloc. Soft US data helped the pair to advance up to 1.2887 during US trading hours, but gains were quickly trimmed, as upcoming general elections in the UK and following start of Brexit negotiations, dent demand for the Pound. The UK will release its money figures this Wednesday, but will likely pass unnoticed in price action, although later on the week, the kingdom will release PMIs figures, which will have more weigh on the GBP’s value. From a technical point of view, the risk remains towards the downside, given that in the 4 hour chart, the price remains well below a bearish 20 SMA, whilst technical indicators head nowhere, but hold within negative territory. Approaches to the 1.2920 region, will likely result in a retracement, not because of selling interest aligned around it, but because of dollar’s bears taking profits out of the table, not willing to risk much ahead of June 8th.
Support levels: 1.2790 1.2765 1.2730
Resistance levels: 1.2840 1.2885 1.2920
GOLD
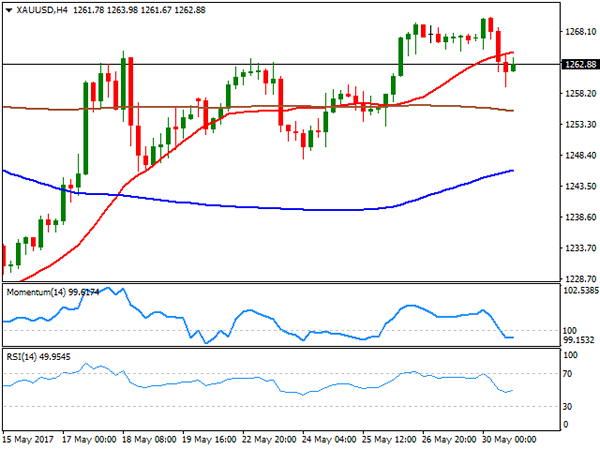
Spot gold was unable to sustain early gains, closing the day down at $ 1,262.97 a troy ounce, with no certain catalyst behind the decline and is spite of dollar’s weakness. Risk aversion backed the metal at the beginning of the day, fueled by news suggesting that the country might opt out its next payment, but retreated after official sources denied it. Speculative interest is now centered on the upcoming US Nonfarm Payroll report to be released next Friday, hoping it will clear the picture over what the Fed will do this June. The technical picture has barely changed, as in the daily chart, the price remains within its latest consolidative range and above its moving averages, whilst technical indicators pulled modestly lower, but remain well above their mid-lines. In the 4 hours chart, however, the risk turned towards the downside, as the commodity settled below its 20 SMA, whilst technical indicators have entered negative territory, but have lost directional strength, overall indicating that a downward correction is possible, although far from suggesting a steeper bearish movement.
Support levels: 1,254.60 1,245.20 1,238.50
Resistance levels: 1,272.90 1,283.10 1,290.00
WTI CRUDE OIL
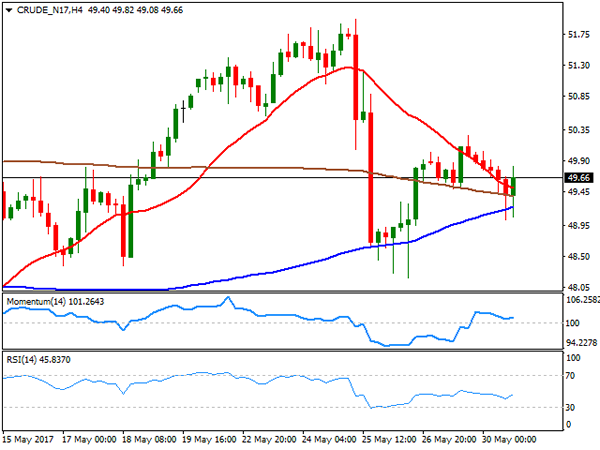
West Texas Intermediate crude oil futures edged lower on Tuesday, settling at $49.65 a barrel, weighed by news indicating that Libya’s oil production is expected to start rising to 800,000 bpd. Speculative interest was already doubting OPEC’s extension of its output cut deal would be enough to offset rising oil production, and news like this further dent sentiment towards the commodity. From a technical point of view, the daily chart shows that WTI managed to bounce from a bullish 20 SMA, whilst the Momentum indicator is losing downward strength, turning flat right above its 100 level, whilst the RSI indicator hovers around 50, indicating diminishing buying interest. In the shorter term, the 4 hours chart the price is struggling around a congestion of moving averages, whilst technical indicators turned lower within neutral territory, leaving it at risk of falling further, particularly on a break below 49.03, the daily low.
Support levels: 49.00 48.35 47.60
Resistance levels: 49.80 50.50 51.20
DJIA
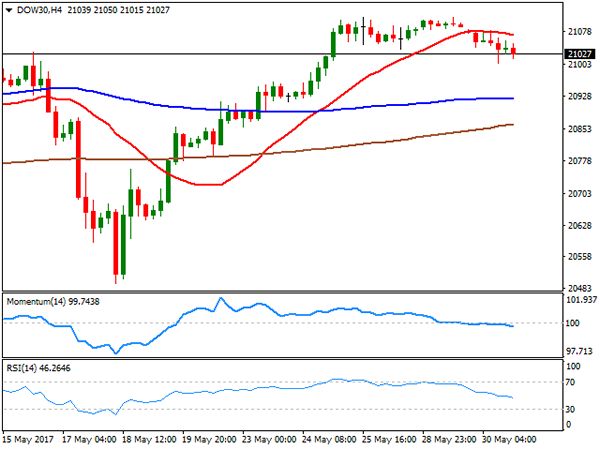
Wall Street put an end to a seven-day winning streak, weighed by declines in the energy and the financial sector. The Dow Jones Industrial Average lost 50 points or 0.24%, to close at 21,029.47, while the S&P settled at 2,412.91, down 0.12%. The Nasdaq Composite ended at 6,203.19, after losing 7 points or 0.11%. Within the Dow, Goldman Sachs was the worst performer, down 1.6%, while Morgan Chase that shed 1.71%. Chevron and Exxon Mobile followed suit, undermined by weaker oil prices. Verizon Communications on the other hand, led winners’ list with a 1.94% gain. The daily chart for the DJIA shows that the index remains above horizontal moving averages, whilst technical indicators keep losing ground within positive territory, increasing chances of a downward corrective movement. In the 4 hours chart, the technical outlook also favors a downward move, with the index developing below a marginally bearish 20 SMA, whilst technical indicators gain bearish traction within negative territory.
Support levels: 21,003 20,972 20,940
Resistance levels: 21,048 21,075 21,112
FTSE100
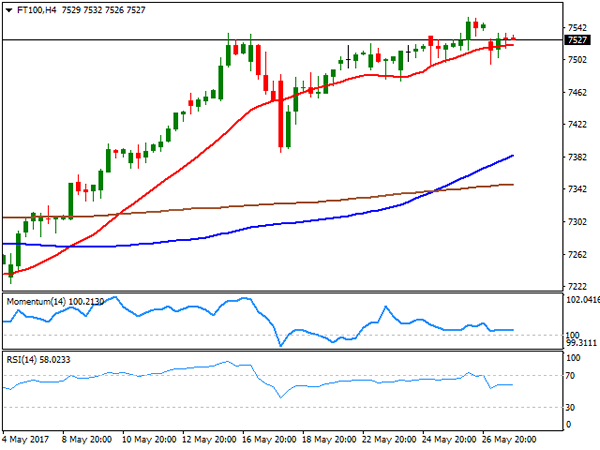
The FTSE 100 retreated from record highs, shedding 21 points this Tuesday to close at 7,526.51. The sour sentiment around European equities weighed on the Footsie alongside with further Pound’s gains. Financial-related equities were among the worst performers, following the lead of their EU counterparts. Mediclinic international was the worst performer, down 3.25% and followed by Shire that lost 3.19%. 3i Group on the other hand led gainers for a second consecutive session, adding 2.30%. The index retains its bullish tone, although a downward corrective movement can’t be disregarded, given that in the daily chart, technical indicators are beginning to pullback from overbought readings, although the index remains well above bullish moving averages, suggesting slides will likely remain limited. Shorter term, and according to the 4 hours chart, the technical outlook turned neutral, with the index now a few points above a horizontal 20 SMA, and technical indicators heading nowhere, with the Momentum around its mid-line and the RSI indicator around 58, this last, also limiting chances of a downward move.
Support levels: 7,515 7,490 7,455
Resistance levels: 7,554 7,590 7,620
DAX
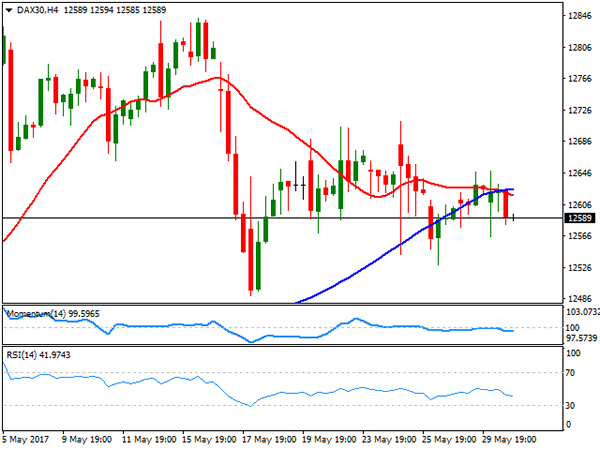
European equities closed in the red this Tuesday, with the banking sector leading the way lower. The German DAX lost 30 points and closed at 12,598.68, with Deutsche Bank leading decliners with a 1.64% loss. European jitters weighed on equities, particularly on news that Italy may call for an early election. The banking sector in the country has been on a tear for over a year already, and the main reason why Mateo Renzi took a step down. Also, weighing on the DAX were softer-than-expected preliminary May figures. The index remained confined to a tight range daily basis, consolidating below a flat 20 DMA and with technical indicators gaining bearish traction within neutral territory, not enough to support a steeper decline, but suggesting buyers have taken a step back at the moment. Shorter term, and according to the 4 hours chart, the index was unable to advance beyond the 12,630 region, where the 20 SMA converges with the 100 SMA, whilst technical indicators lack directional strength, retaining a neutral stance.
Support levels: 12,542 12,490 12,430
Resistance levels: 12,631 12,675 12,729


