EUR/USD
Dollar’s weakness became more evident this Wednesday, as despite news coming from Europe were far from encouraging, the EUR/USD pair managed to regain the 1.1200 level, advancing towards the 1.1230 region during London trading hours, later fueled by another batch of US negative data to top for the day at 1.1251.
European CPI surprised to the downside, as in May, inflation rose by less than expected according to preliminary estimates with headline yearly inflation rising by 1.4%, below previous 1.9%, with most of the advance having been attributed to rising energy prices. Seems Draghi’s stance of keeping QE alive was not that wrong after all. The region’s unemployment rate fell 5.7%, the lowest in over eight years. In the US, Pending Home Sales fell for a second consecutive month in April, down by 1.3%, while the Chicago PMI was initially released at 55.2, compared to previous 58.3 and the expected 57.0, but re-released a couple of hours later at 59.4, the best reading since November 2014. The damage, however, was done and the dollar plunged, with Wall Street also falling sharply. The corrected number was enough to pare dollar’s decline, but failed to trigger demand for the troubled currency.
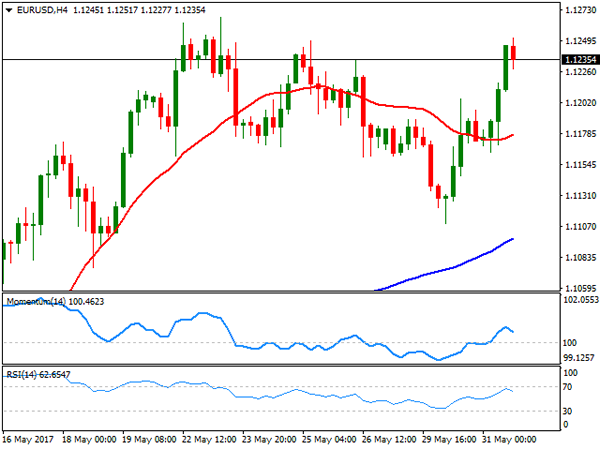
From a technical point of view, the pair has recoup its bullish stance, with the price above a flat 20 SMA, in the 4 hours chart, but with the larger ones heading north far below it, and technical indicators losing upward strength, but holding near their daily highs. Overall, the pair looks poised to extend its advance, although it would take an advance beyond 1.1265 to confirm such extension towards 1.1300 and beyond.
Support levels: 1.1200 1.1160 1.1120
Resistance levels: 1.1265 1.1300 1.1345
USD/JPY
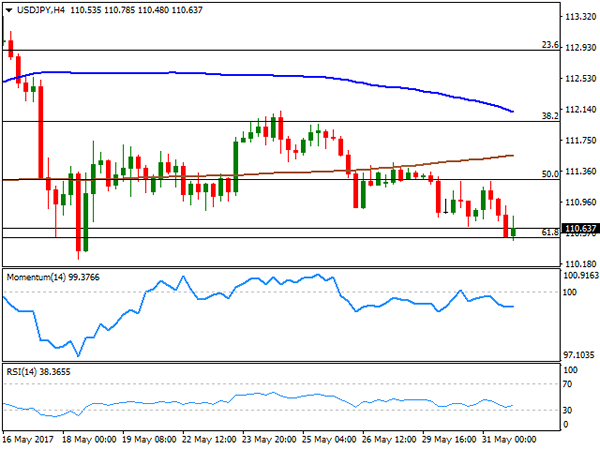
The USD/JPY pair stretched its weekly decline to 110.48, ending the day a handful of pips above this last, as the yen found strength in the poor performance of US equities and yields. US Treasury yields fell to multi-week lows in the last day of May, with the 30-year benchmark down to 2.86% from previous 2.89% and 10-year note one down to 2.20% from previous 2.22%. The decline stalled after the second release of the Chicago PMI, initially misreported, but the strong number was not enough to trigger dollar demand, clearly indicating that the risk remains towards the downside. From a technical point of view, the 4 hour chart shows that the price is struggling around the 61.8% retracement of the latest bullish run at 110.50, whilst the 100 and 200 SMAs remain well above the current level, and particularly the shortest gaining bearish strength. In the same chart, technical indicators have turned flat near their daily lows within bearish territory, also favoring a new leg south particularly on a break below the mentioned Fibonacci support.
Support levels: 110.50 110.10 109.75
Resistance levels: 111.10 111.65 112.05
GBP/USD
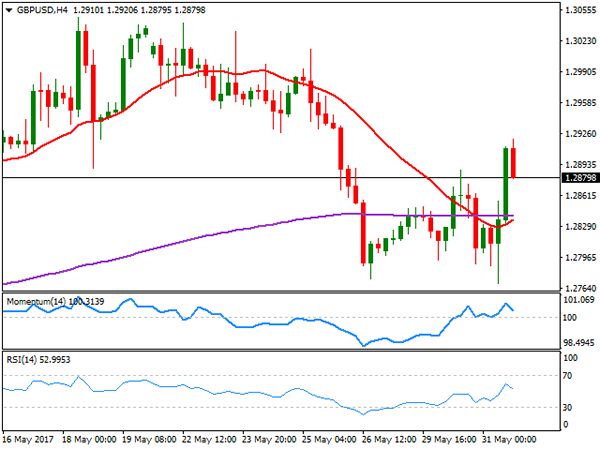
The GBP/USD pair fell to a fresh 1-month low of 1.2769 this Wednesday, undermined by poor UK data and the latest YouGov poll, which estimated that PM May Conservative party may loss up to 20 seats in the upcoming General Election, suggesting that the UK could end up with a hung Parliament. Also, UK money figures showed that net lending to individuals fell to £4.3B in April, missing expectations and below March £4.7B, while mortgage approvals in the month also decreased, standing at 64.645K. The pair changed course on dollar’s weakness, rallying up to 1.2920, helped by a Kantar opinion poll showing that Conservatives’ lead increased from 8, to 10 points. Now trading around 1.2880, the pair was unable to hold on to gains beyond the critical 1.2900 figure, but trades anyway in the green, with the 4 hours chart showing that the price extended well above its moving averages that anyway lack directional strength, whilst technical indicators are retreating within positive territory, reflecting decreasing buying interest around the mentioned level.
Support levels: 1.2830 1.2790 1.2765
Resistance levels: 1.2920 1.2960 1.3000
GOLD
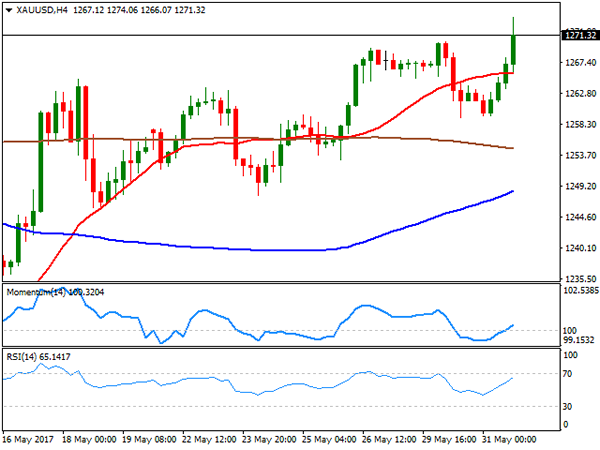
Spot gold ended May on a higher note, up to its highest in over a month and settling at $1,271.43 a troy ounce. Weak US data weighed on the greenback, with investors now speculating whether the Fed will be able to act this June, and if it does as a matter of credibility, how long will it take to move rates again. The sour tone of equities, also backed the safe-haven metal. Gains have been moderated, but the daily chart supports additional advances given that technical indicators have turned back north near overbought readings, whilst the price holds above bullish moving averages. In the 4 hours chart, the price surpassed a bullish 20 SMA, now offering an immediate support at 1,265.90, while technical indicators maintain their sharp bullish slopes after entering positive territory. The commodity has scope to extend its advance up to 1,295.40, April 17th high ahead of the June Fed’s meeting.
Support levels: 1,265.90 1,254.60 1,245.20
Resistance levels: 1,274.05 1,283.10 1,295.40
WTI CRUDE OIL
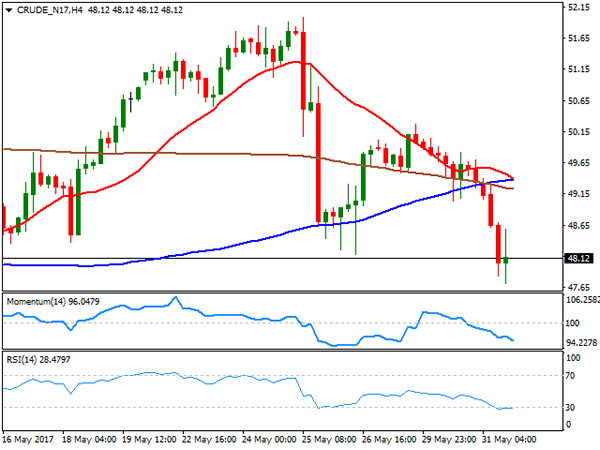
Crude oil prices plunged this Wednesday, with West Texas Intermediate crude futures settling at $48.12 a barrel. The commodity fell to its lowest in three-weeks ahead of the release of US stockpiles data, as speculative interest continues to believe that OPEC’s decision was not enough to offset rising US production. The EIA is expected to report this Thursday a 3.2 million barrels’ fall in crude-oil stockpiles, which may bring some relief to prices. In the meantime, the technical outlook is bearish, given that in the daily chart, the price has broken below a bearish 20 SMA with a long volume candle, while technical indicators have turned south, heading strongly lower now within bearish territory. Shorter term, the 4 hours chart also presents a bearish stance, with the Momentum indicator heading sharply lower below its 100 level, the RSI indicator consolidating around 28, and the price having accelerated after breaking below all of its moving averages, which converge in the 49.30/60 region.
Support levels: 47.70 47.10 46.45
Resistance levels: 48.60 49.30 49.90
DJIA
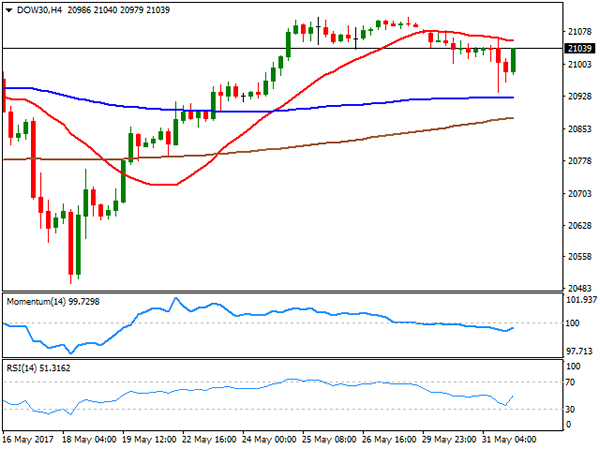
US indexes closed again in the red, with the banking sector being the worst performer. The Dow Jones Industrial Average closed at 21,008.58, down 20 points, while the Nasdaq Composite settled at 6,198.52, down by 0.08% and the S&P closed at 2,411.80, having eased 0.05%. All of the three major indexes closed the month with gains, with the Nasdaq being the best, up in May by2.5%. Stocks started the day with a sour tone, plunging on soft local macroeconomic releases, but trimmed most of their losses after the corrected Chicago PMI was out. Within the Dow, Goldman Sachs was the worst performer, down 3.4% followed by JPMorgan that shed 1.98%. El du Pont was the biggest winner, up 1.65%, followed by Pfizer that added 1.63%. From a technical point of view, the DJIA remains within bullish territory but with no upward momentum, as the daily chart shows that the price bounced sharply on an approach to a horizontal 20 DMA, whilst technical indicators eased modestly near their mid-lines, but still above them. Shorter term, the 4 hours chart shows that a bearish 20 SMA continued to cap the upside, currently at 21,058, while technical indicators recovered modestly within bearish territory, lacking directional momentum and at neutral readings at the time being.
Support levels: 21,003 20,972 20,940
Resistance levels: 21,058 21,075 21,112
FTSE100
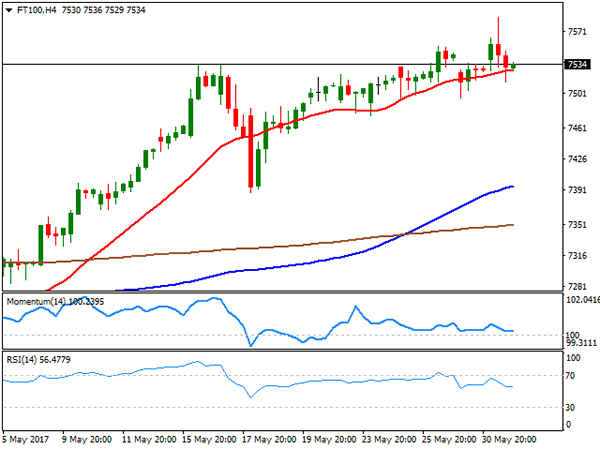
The FTSE 100 closed at 7,519.5, down 0.09% or 6 points daily basis, undermined by a re-surging Pound. The index peaked intraday at an all-time high of 7,587, as Brexit jitters prompted the Pound lower early London, although the movement was later reverted by a softer greenback and a new pre-election poll backing Conservatives. Randgold Resources led advancers with a 2.79% gain, supported by rising gold, but the mining-related bloc closed in the red as base metals eased. The worst performer was Rio Tinto, with a 2.53% decline, followed by BHP Billiton that closed down 2.45% and Glencore that shed 2.36%. Daily basis, technical indicators have eased from oversold readings, with the Momentum somehow anticipating a deeper correction ahead. Still the index is far above bullish moving averages, keeping the downward potential limited. In the 4 hours chart, the index is holding right around a bullish 20 SMA, while the Momentum indicator remains flat around its 100 level, and the RSI indicator pulled back within positive territory, hovering now around 54, also suggesting a possible downward corrective move ahead.
Support levels: 7,515 7,490 7,455
Resistance levels: 7,554 7,587 7,620
DAX
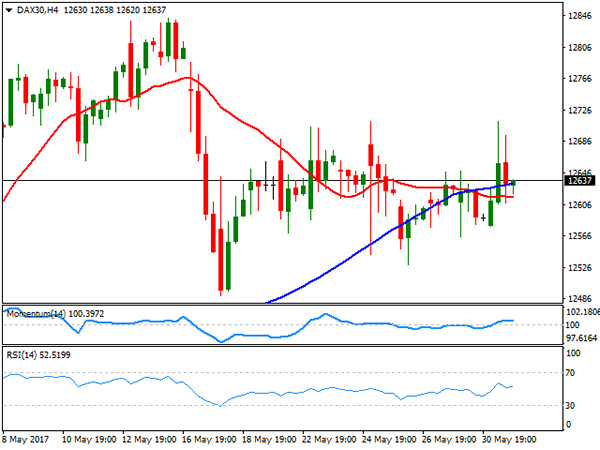
European equities saw strong swings this Thursday, but closed mixed and not far from their daily openings. The German DAX settled at 12,615.06, up 16 points or 0.13%, pulling back from an intraday high of 12,711 on the back of poor European inflation figures. An advance in the utilities and pharmaceutical sectors helped the DAX to remain afloat, with E.ON leading the way higher, up 2.59% at the end of the day, followed by Fresenius that added 2.48%. Deutsche Bank led decliners, easing 2.94%, followed by Adidas that shed 1.94%. The index retains its neutral stance in the daily chart, as indicators continue heading nowhere around their mid-lines, whilst the intraday advance was once again contained by a modestly bullish 20 SMA. In the 4 hours chart, the benchmark settled around its 20 and 100 SMAs, both converging in a tight range, while technical indicators are also stuck around their mid-lines, reflecting the cautious mood persisting among investors.
Support levels: 12,602 12,542 12,490
Resistance levels: 12,675 12,729 12,800