
The EUR/USD currency pair
Technical indicators of the currency pair:
Prev Open: 1.12120
Open: 1.12038
% chg. over the last day: -0.08
Day’s range: 1.12001 – 1.12287
52 wk range: 1.1214 – 1.2557
EUR partially recovered against the USD. Right now the quotes are testing the local supply zone at 1.12250-1.12450. The key support is at 1.11850. The financial market participants are watching the US/China trading negotiations. According to the Financial Times, both sides have settled their differences and are going to sign the deal soon. Keep an eye on this issue, as well as the today’s economic releases that can offer insight in the future of major currencies. Open the positions from the key levels.
The Economic News Feed for 03.04.2019:
Business activity indicators (EU) – 11:00 (GMT+3:00);
ADP’s Preliminary Labour Market Report (US) – 15:15 (GMT+3:00);
Non-industrial PMI by ISM (US) – 17:00 (GMT+3:00);
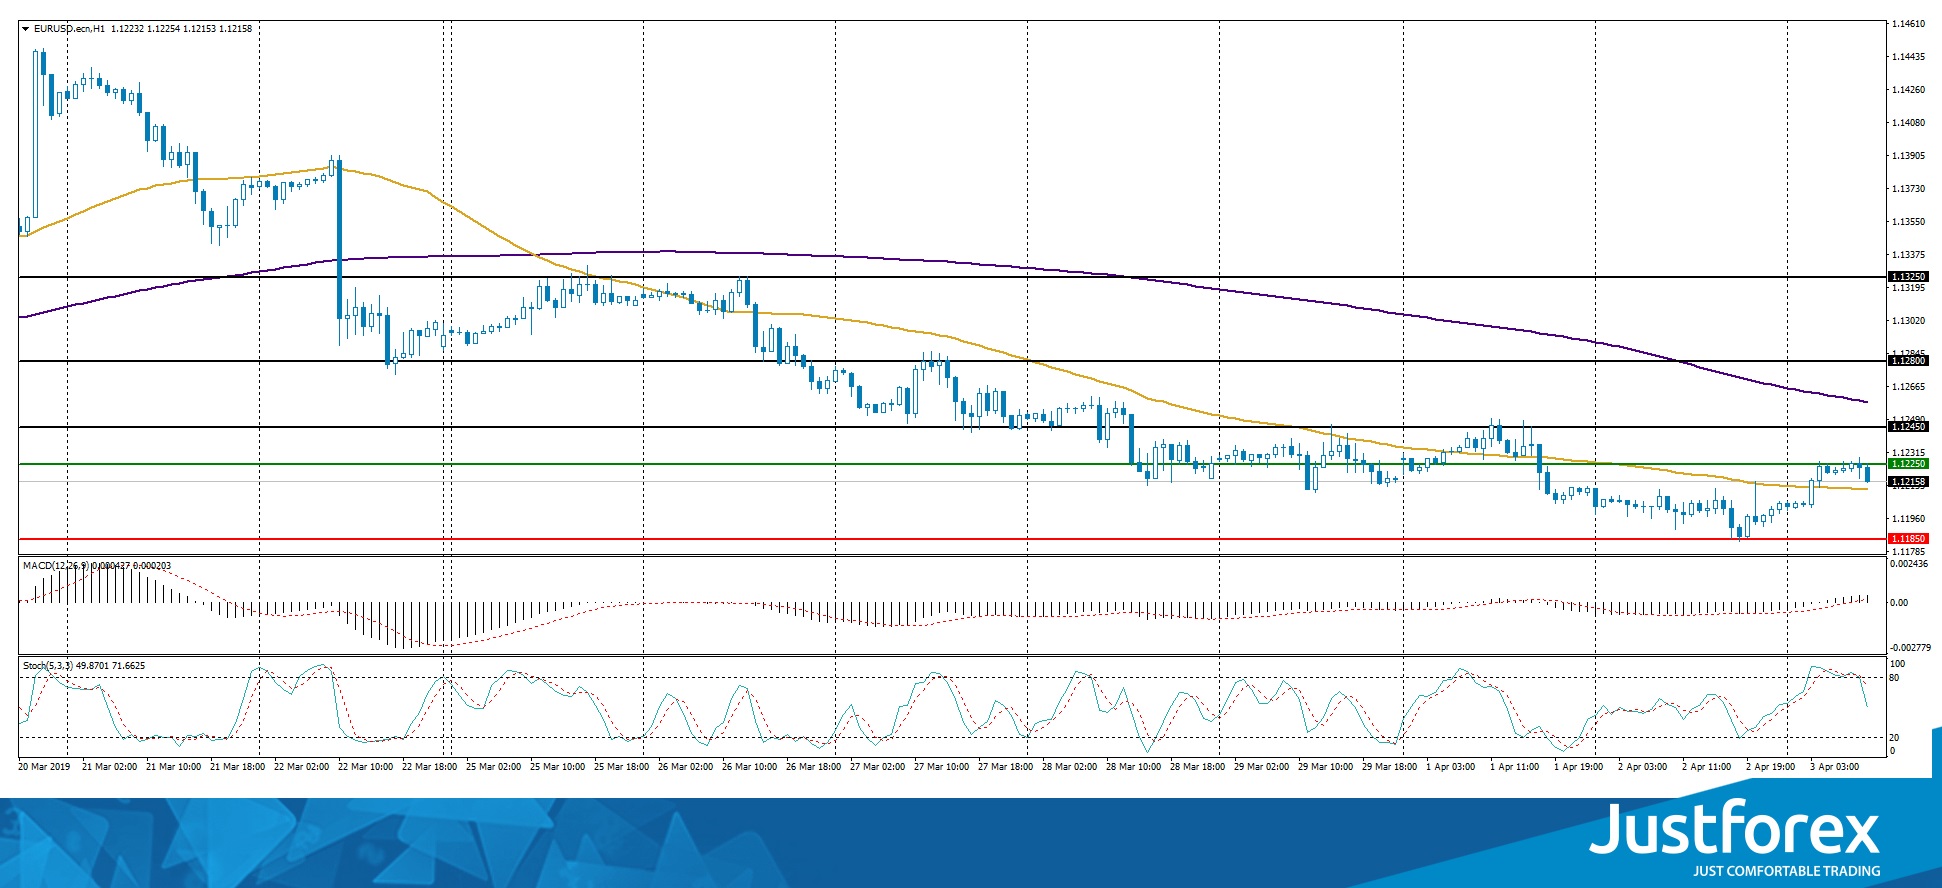
The indicators do not provide precise data, the price fixed between 50 MA and 200 MA.
The MACD histogram moved to the positive zone, which points to the bullish mood.
The Stochastic Oscillator is in the neutral zone, the %K line is below the %D line which gives a signal to sell EUR/USD.
Trading recommendations
Support levels: 1.11850, 1.11500
Resistance levels: 1.12250, 1.12450, 1.12800
If the price fixes above 1.12250, expect the qutoes to correct further toward 1.12700-1.13000.
Alternatively, the quotes can descend toward 1.11600-1.11400.
The GBP/USD currency pair
Technical indicators of the currency pair:
Prev Open: 1.30925
Open: 1.31302
% chg. over the last day: +0.20
Day’s range: 1.31215 – 1.31931
52 wk range: 1.2438 – 1.4378
GBP/USD started to grow and updated the local maximums. The worries about the “hard Brexit” were debunked by Theresa May’s statement that she will request another delay for Brexit. Right now the quotes are close to 1.32000 with 1.31500 acting as a mirror support. GBP can recover further. You should open positions from the key levels.
At 11:30 (GMT+3:00) the UK will release a service industry PMI.
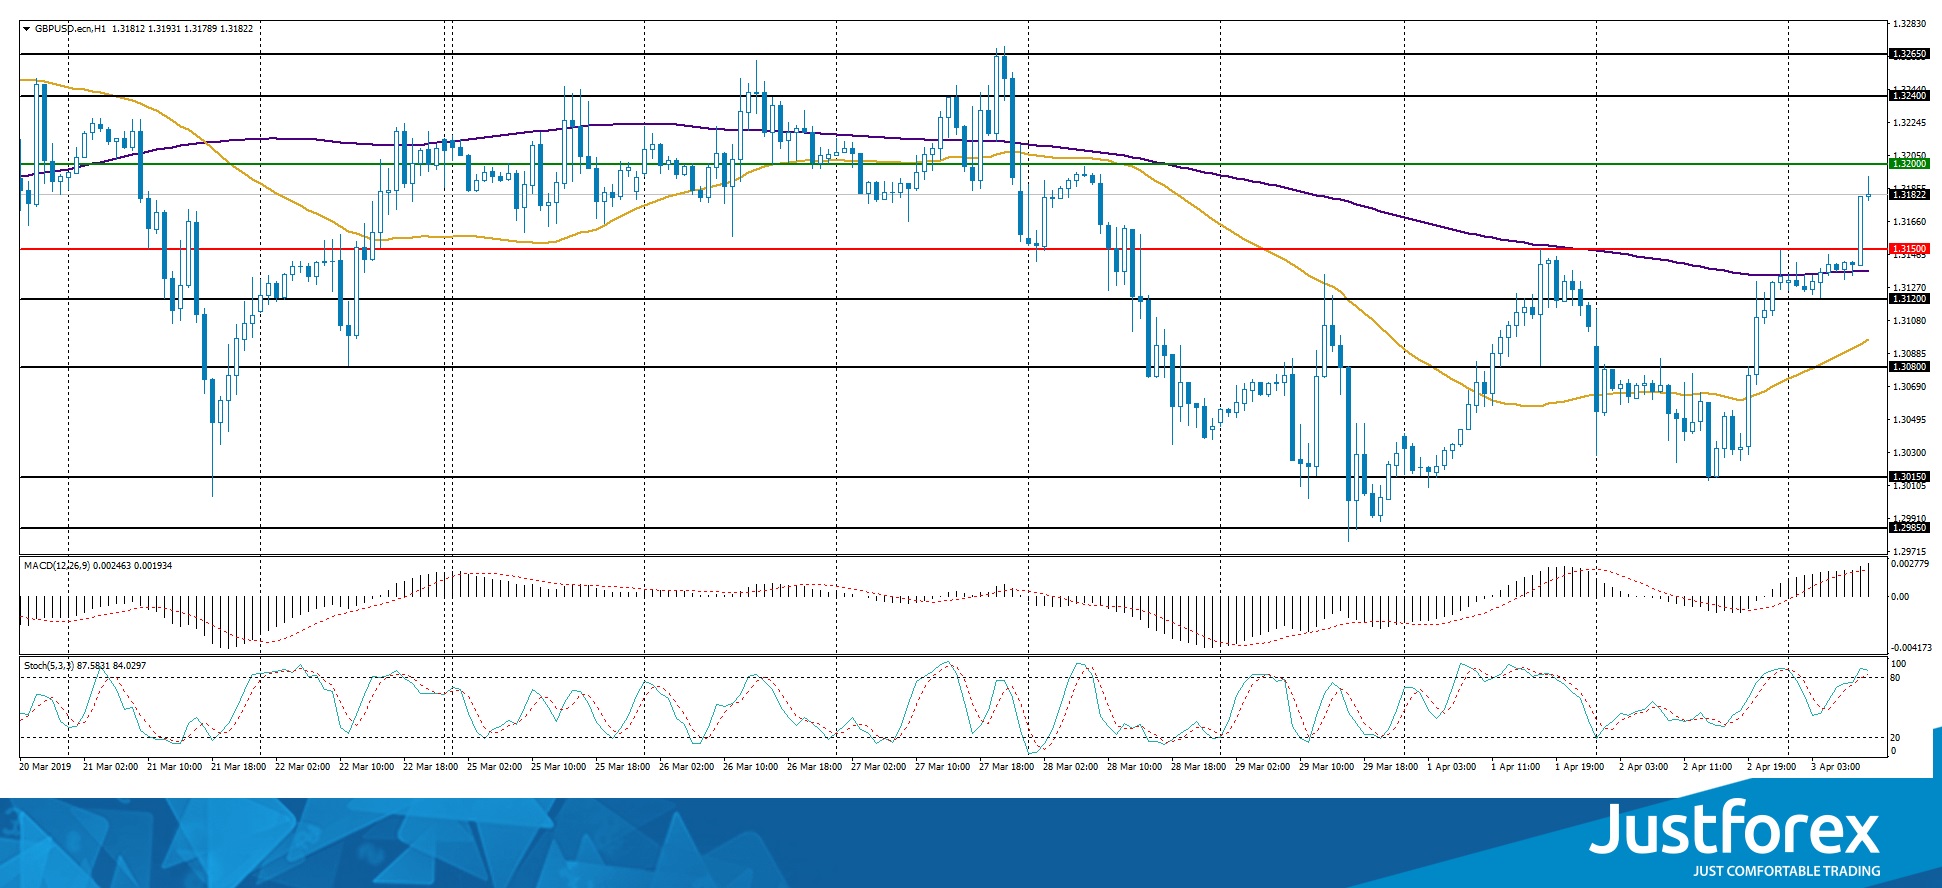
The price fixed above 50 MA and 200 MA which points to the power of the buyers.
The MACD histogram is in the positive zone and above the signal line which points to the bullish mood.
The Stochastic Oscillator is inear the overbought zone, the %K line is above the %D line which also gives a weak signal to buy GBP/USD.
Trading recommendations
Support levels: 1.31500, 1.31200, 1.30800
Resistance levels: 1.32000, 1.32400, 1.32650
If the price fixes above the round 1.32000, expect the qutoes to grow toward 1.32400-1.32650.
Alternatively, the qutoes can fall toward 1.31200-1.31000.
The USD/CAD currency pair
Technical indicators of the currency pair:
Prev Open: 1.33046
Open: 1.33362
% chg. over the last day: +0.27
Day’s range: 1.33026 – 1.33531
52 wk range: 1.2248 – 1.3664
USD/CAD started to descend again. Right now the trading instrument is testing 1.33000. The key resistance is as 1.33400. The pressure on the USD is caused by the weak economic releases. The bullish mood on the oil market keeps up the demand for CAD. The currency pair can descend further, so keep an eye on the US news feed and open the positions from the key levels.
The Economic News Feed for 03.04.2019 is calm.
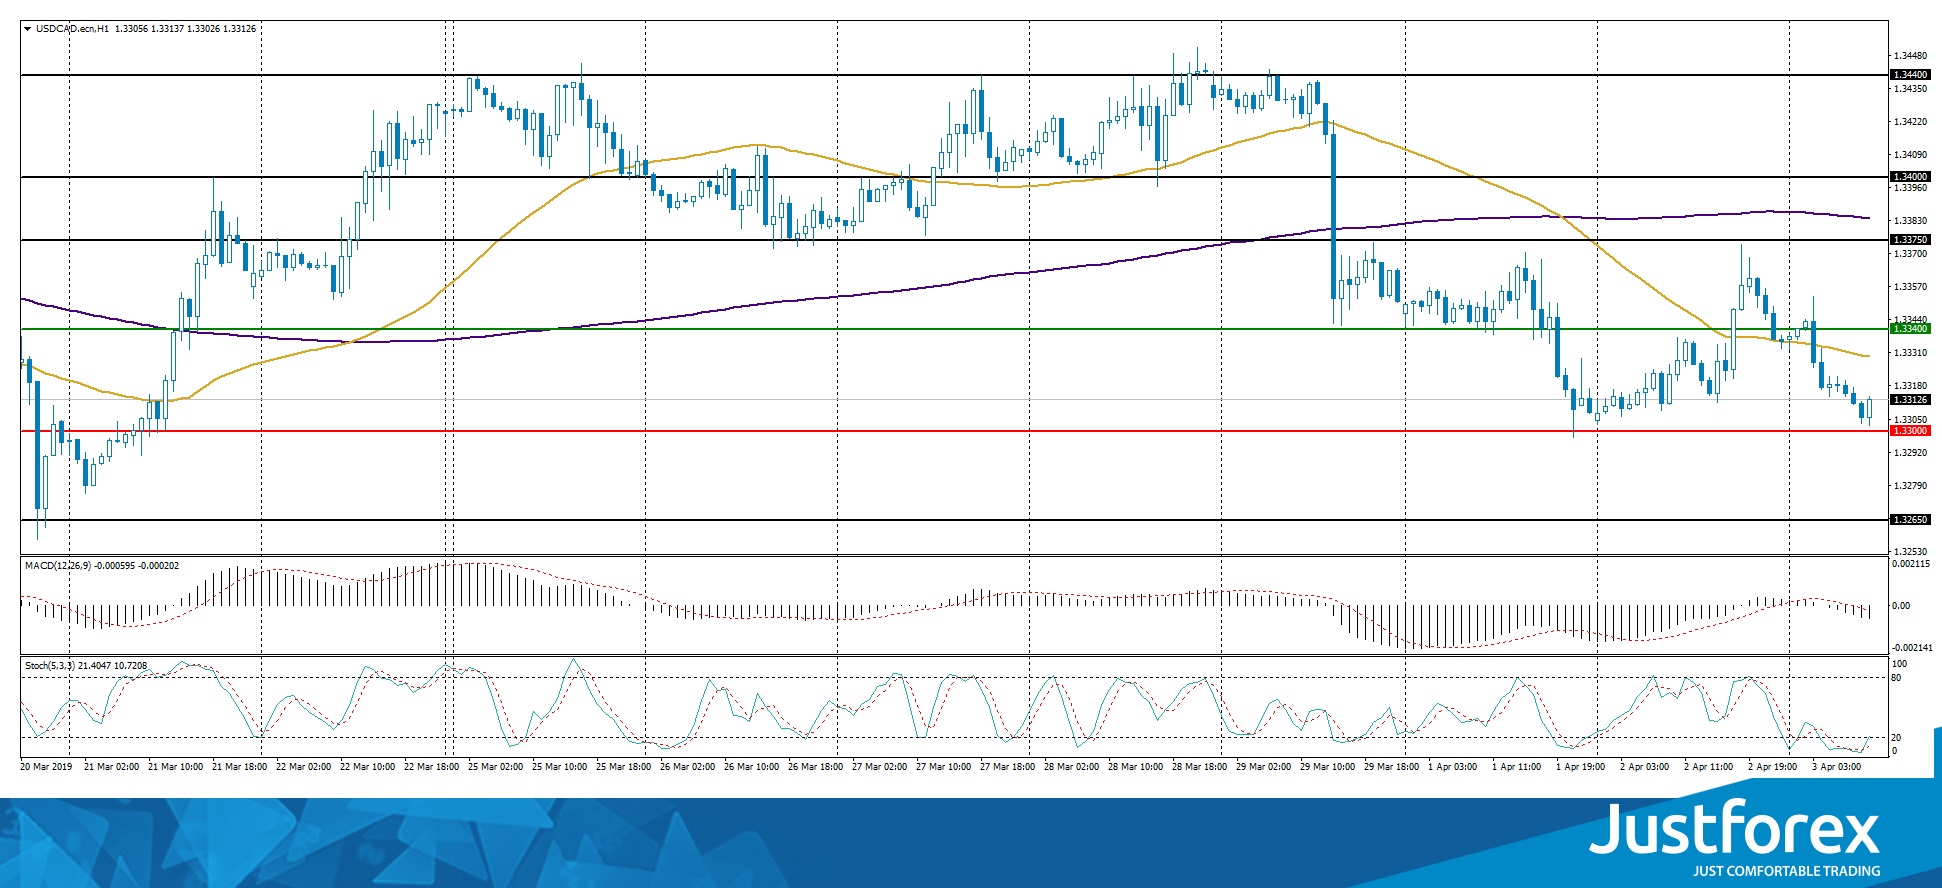
The price fixed below 50 MA and 200 MA which points to the power of the buyers.
The MACD histogram is in the negative zone and below the signal line which gives a strong signal to sell USD/CAD.
The Stochastic Oscillator is in the oversold zone, the %K line is crossing the %D line. There are no signals at the moment.
Trading recommendations
Support levels: 1.33000, 1.32650
Resistance levels: 1.33400, 1.33750, 1.34000
If the price fixes below the round 1.33000, expect the quotes to fall further toward 1.32700-1.32500.
Alternatively, the quotes can grow toward 1.33700-1.33900.
The USD/JPY currency pair
Technical indicators of the currency pair:
Prev Open: 111.344
Open: 111.314
% chg. over the last day: -0.03
Day’s range: 111.209 – 111.579
52 wk range: 104.56 – 114.56
USD/JPY keeps showing a positive trend. Right now the trading instrument is testing the local resistance at 111.550. 111.150 acts as a mirror support. USD/JPY has further growth prospects. Keep an eye on the relevant data regarding the US/China negotiations. Open the positions from the key levels.
The Economic News Feed for 03.04.2019 is calm.
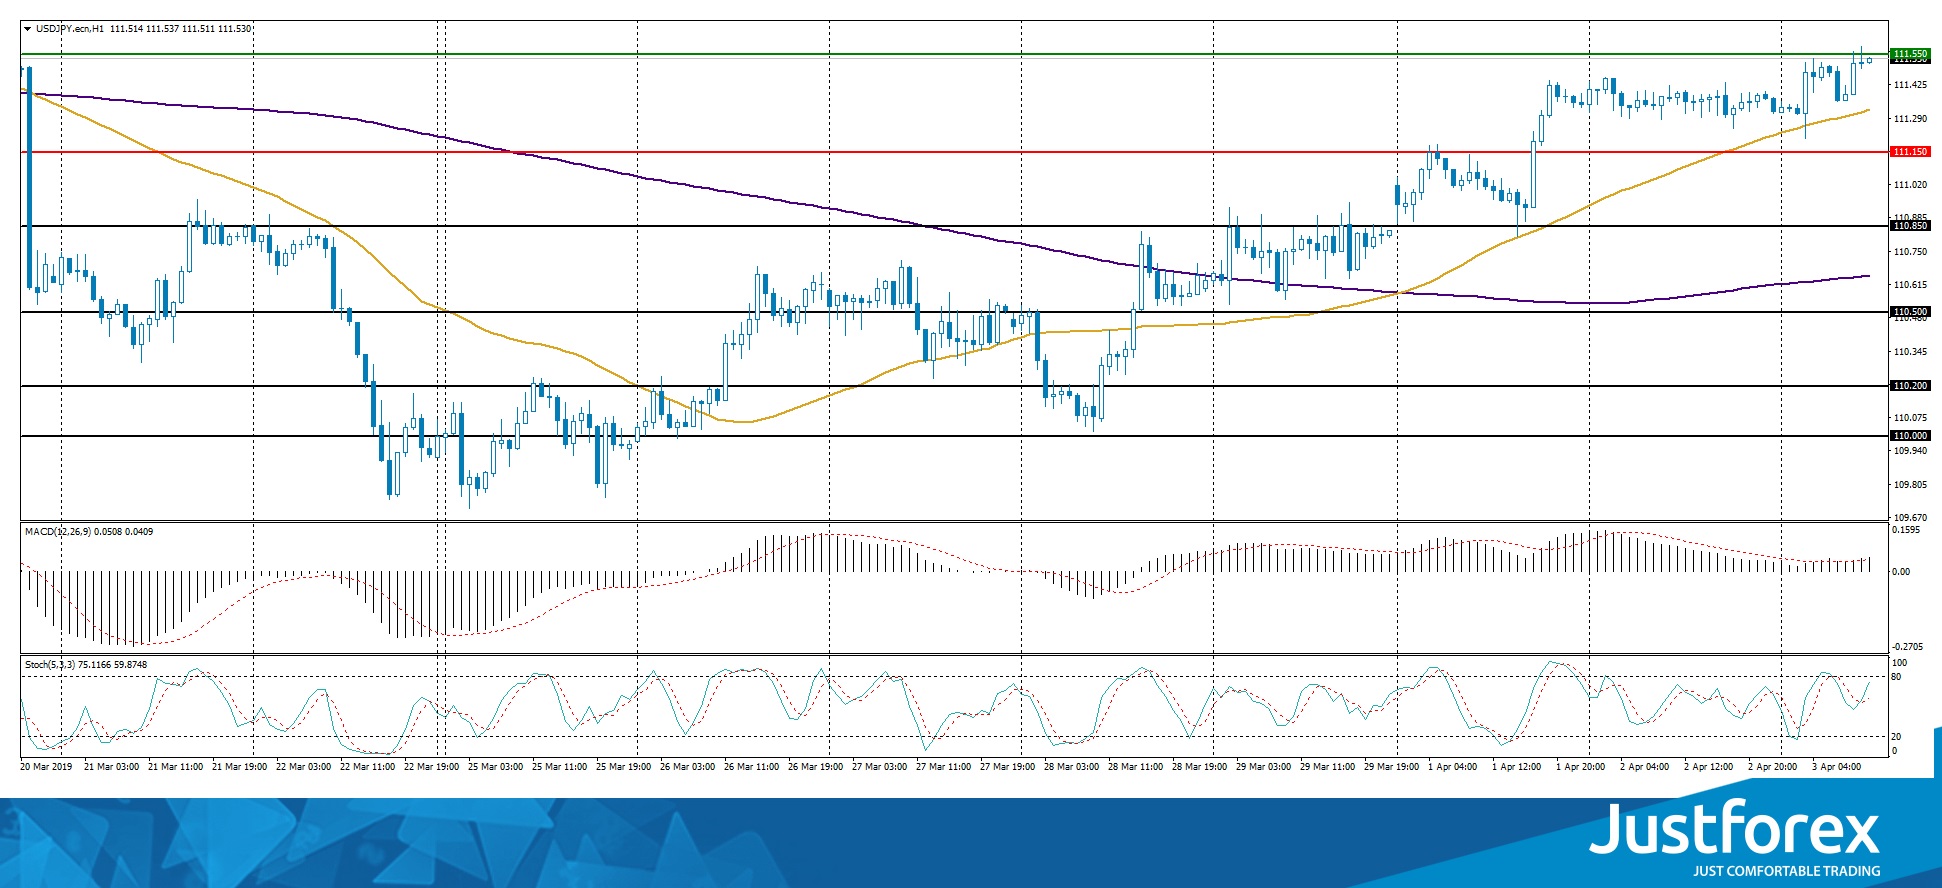
The price fixed above 50 MA and 200 MA which points to the power of the buyers.
The MACD histogram is in the positive zone and above the signal line which gives a strong signal to buy USD/JPY.
The Stochastic Oscillator is in the neutral zone and above the signal line which also points to the bullish mood.
Trading recommendations
Support levels: 111.150, 110.850, 110.500
Resistance levels: 111.550, 112.000
If the price fixes above 111.550, expect the further growth toward 112.000.
Alternatively, the qutoes can fall toward 110.850-110.600.


