EUR/USD
The EUR/USD pair ended marginally lower this Thursday, with the dollar finding support in a stronger-than-expected ADP employment survey. The US private sector added 253,000 new jobs in May, well above market’s forecast of 239K and previous 174K. Unemployment claims however, surged in the week ended May 26, with the number of Americans filing for benefit claims reaching 248K from previous 235K, pausing initial enthusiasm over the US employment sector’s health. Both numbers, however, anticipate another solid NFP report for this Friday that anyway would probably do little for the greenback, unless it’s a big disappointment, in which case, will only fuel the negative stance towards the US currency.
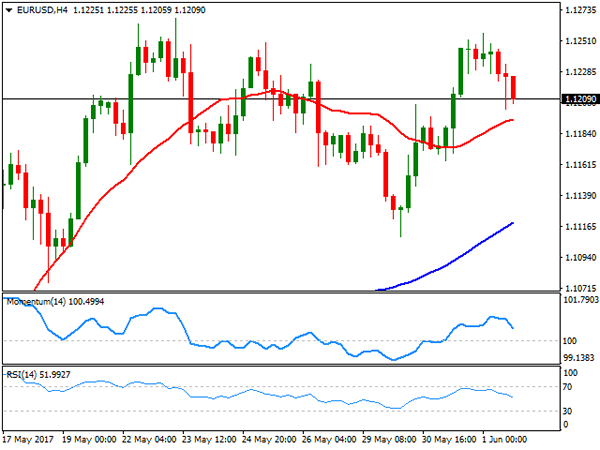
Technically, the bullish momentum in the pair has faded partially, but the pair is far from bearish, considering is barely 50 pips away from its 2017 high. The 4 hours chart shows that the price holds above all of its moving averages, with the 20 SMA barely below the current level and losing upward strength, whilst technical indicators eased within positive territory, nearing their mid-lines. Anyway, much of the upcoming direction will depend on the outcome of the NFP report, with the scale lean towards the upside. The pair topped at 1.2156 this week, and at 1.2167 for May and 2017, the level to surpass to confirm further gains ahead. Below 1.1160, on the other hand, the downward corrective movement could extend down to 1.1080 without actually affecting the dominant bullish trend.
Support levels: 1.1200 1.1160 1.1120
Resistance levels: 1.1265 1.1300 1.1345
USD/JPY
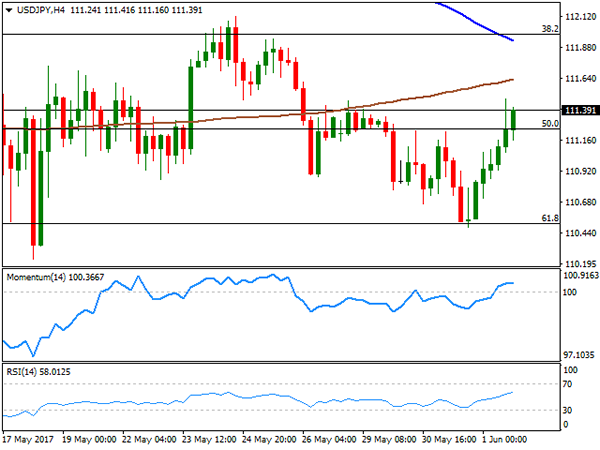
The USD/JPY pair recovered ground, advancing up to 111.47 in the American afternoon, and settling not far below it. The recovery may have had more to do with technical readings than with fundamentals, as the pair bottomed around 110.50 late Wednesday, the 61.8% retracement of the 108.12/114.36 rally seen between April and May. The Nikkei-Markit manufacturing PMI rose to 53.1 in May from, 52 .7 in April, a healthy figure, although rising yields and a strong ADP report weighed more. The short term picture is modestly positive for the USD/JPY pair, as the pair remains near its daily highs, whilst technical indicators in the 4 hours chart stand in positive territory. Still, the price remains below its moving averages, and more relevant, the 112.00 level, the 38.2% retracement of the mentioned rally and where the pair met selling interest last week. The US Nonfarm Payroll report will need to surprise big towards the upside to be able to push the pair beyond this last.
Support levels: 111.20 110.80 110.50
Resistance levels: 111.60 112.00 112.45
GBP/USD
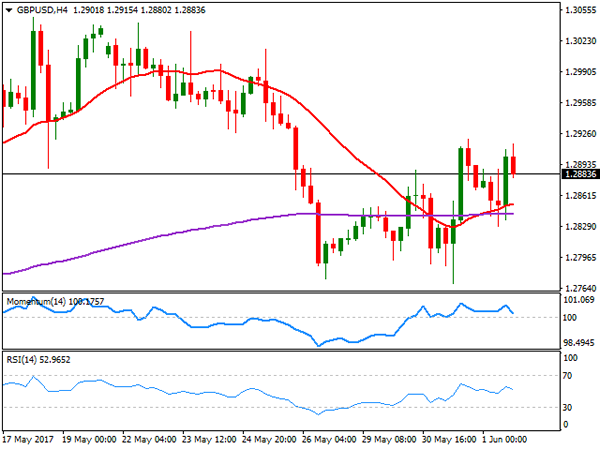
The GBP/USD pair stands barely 10 pips above from its daily opening, having traded on the upper half of Wednesday’s range over the past 24 hours, but unable to regain the 1.2900 mark. News coming from the UK were a bit better this Thursday, as the UK final Markit manufacturing PMI came in at 56.7, better than the 56.5 expected and not far below the three-year high posted in April at 57.3. Election’s jitters however, still weigh on Pound, with polls coming at a faster pace just one week ahead of the event, and with more notorious headlines. The latest one, published by The Independent, showed that PM May’s lead is at its lowest, just three points ahead of her Labour rivals, clearly limiting Pound’s gains. Technically, the 4 hours chart shows that choppy trading persists, but also that the price is above its 20 SMA and 200 EMA, both in a tight range in the 1.2840/50 region, whilst technical indicators turned lower within positive territory, heading lower within neutral territory. Given Pound’s weakness, a strong US employment report could put the pair under pressure, but a break below the 1.2760 region seems unlikely at this point.
Support levels: 1.2840 1.2800 1.2760
Resistance levels: 1.2920 1.2960 1.3000
GOLD
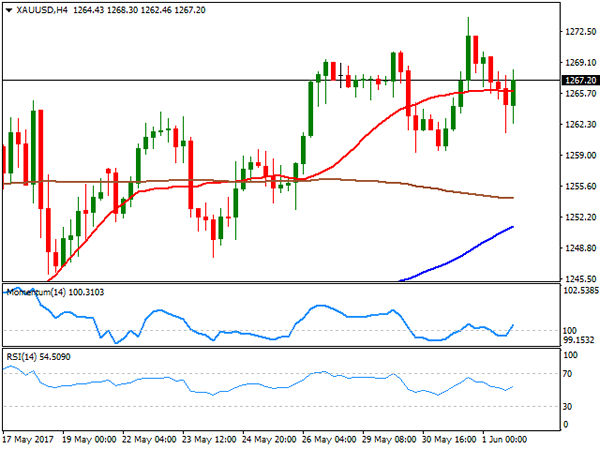
Spot gold lost some ground this Thursday, ending at $1,267.41 a troy ounce. The commodity held steady after reaching a fresh 1-month high on Wednesday, easing modestly amid a stronger greenback and resurging optimism among stocks’ traders. Still, investors remained in cautious mode ahead of the NFP report and upcoming events this June, including the UK election and the US Fed meeting. From a technical point of view, the commodity remains in positive territory but losing upward potential, as in the 4 hours chart, the price remains well above its moving averages, although technical indicators hover within positive territory, turning modestly lower but with not enough strength to support a downward move. In the 4 hours chart, the price is hovering around a flat 20 SMA, whilst technical indicators turned north around their mid-lines, but remain below previous weekly highs, suggesting that a break above the high set at 1,274.05 is required to confirm additional gains ahead.
Support levels: 1,265.90 1,254.60 1,245.20
Resistance levels: 1,274.05 1,283.10 1,295.40
WTI CRUDE OIL
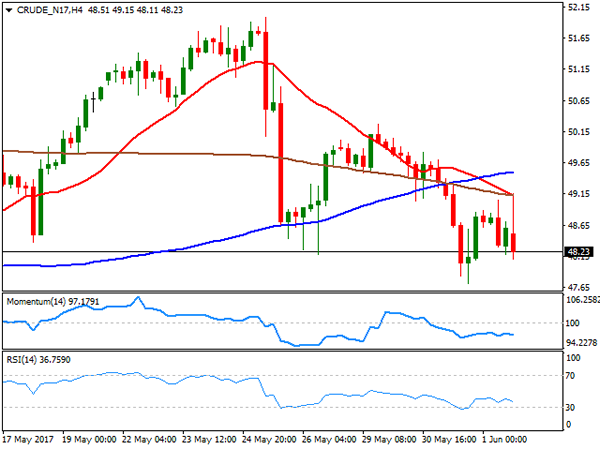
Crude oil prices advanced intraday following the release of the US EIA report, showing that US commercial stockpiles fell by 6.4 million barrels in the week ended May 26, beating expectations of a 2.5 million barrels’ decline. Nevertheless, the commodity was unable to hold on to gains, and closed the day in the red, with West Texas Intermediate futures settling at $48.20 a barrel, despite being the eighth consecutive drop in US stockpiles, as the report also showed that inventories stand near record highs, whilst refineries keep operating at 95% of their capacity. The daily chart shows that the price remained below its moving averages and trading within the lower half of Wednesday’s range, whilst technical indicators entering bearish territory, and particularly the RSI heading south around 41. In the 4 hours chart, selling interest surged on a test of a bearish 20 SMA, whilst technical indicators have lost their bearish strength, but hold well below their mid-lines.
Support levels: 47.70 47.10 46.45
Resistance levels: 48.60 49.30 49.90
DJIA
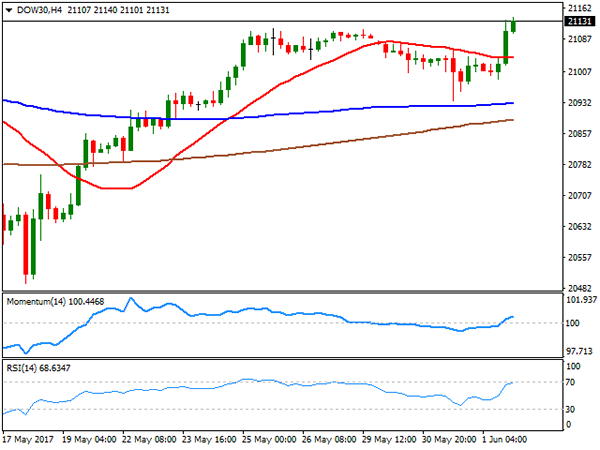
Wall Street rallied this Thursday, with the Dow Jones Industrial Average settling at an all-time high of 21,144.18, up by 135 points, while the Nasdaq Composite also advanced, adding 48 points to end at 6,246.83. The S&P closed at 2,430.06, up by 0.76%. A better-than-expected ADP report boosted markets’ confidence, alongside with upward revisions to final manufacturing PMIs in May. Financials and health-care equities led the advance, with UnitedHealth Group up 2.32%, followed by Goldman Sachs that gained 1.79%. Nike was the worst performer, down by 1.08%, followed by Verizon Communications that shed 0.50%. The Dow daily chart shows that technical indicators head north after bouncing from their mid-lines, maintaining their upward strength, and near its recent highs, whilst the index is advancing above a still horizontal 20 DMA. In the shorter term, and according to the 4 hours chart, the benchmark accelerated through a still flat 20 SMA, while technical indicators entered positive territory with a moderate upward momentum, supporting additional gains that will anyway depend on the NFP report.
Support levels: 21,091 21,045 21,002
Resistance levels: 21,140 21,190 21,235
FTSE100
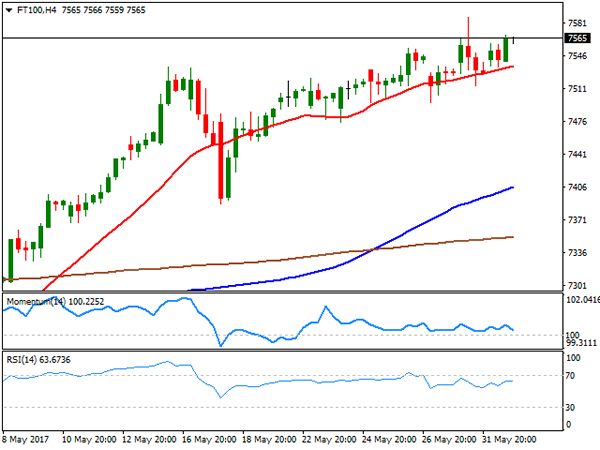
The FTSE 100 added 23 points, to end at 7,543.77 this Thursday, recovering after a two-day decline, helped by a mute Pound and better-than-expected local manufacturing data. Additionally, stocks’ traders sentiment improved following the release of the US ADP employment survey, anticipating some strong gains in the jobs’ sector for May. Exporters were among the best performers, with Paddy Power up 4.34%, leading advancers, followed by 3i Group that added 3.58%. Mediclinic was the worst performer, down by 3.40%. The daily chart for the index shows that it stalled near the intraday record high posted on Wednesday, still holding on to a bullish stance, as technical indicators resumed their advances within positive territory, whilst the index remains far above bullish moving averages. In the shorter term, and according to the 4 hours chart, the index keeps finding buying interest on retracements towards a bullish 20 SMA, whilst the Momentum indicator remains flat around its 100 level, while the RSI indicator heads modestly higher around 65, in line with further advances.
Support levels: 7,550 7,515 7,490
Resistance levels: 7,587 7,620 7,660
DAX
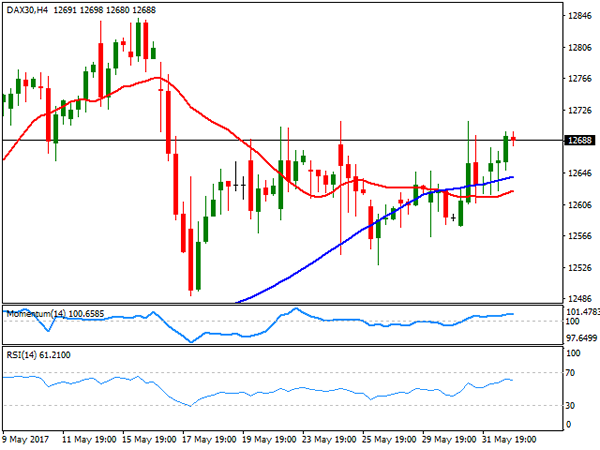
The German DAX advanced 50 points or 0.40% at 12,664.92, up daily basis on the back of positive data coming from both shores of the Atlantic. The EU manufacturing sector was confirmed to have grew at its fastest pace in six years last May, prompting demand for local equities. Within the DAX Linde was the best performer with a 3.24% gain, followed by Bayerische Motoren that added 1.87%, with the automotive sector leading the advance. ThyssenKrupp led decliners with a 1.31% loss, followed by Deutsche Boerse that closed 0.63% lower. The index is slowly grinding higher near record highs, but still lacks momentum in the daily chart, given that the index is now hovering around its 20 SMA, whilst the Momentum indicator remains flat around its 100 level. The RSI indicator however, aims north around 59, anticipating some additional gains for this Friday. In the 4 hours chart, the technical outlook is neutral-to-positive, as technical indicators hold flat within positive territory, as the index develops above its 20 and 100 SMAs, both lacking directional strength.
Support levels: 12,649 12,602 12,542
Resistance levels: 12,729 12,781 12,843