
The EUR/USD currency pair
Technical indicators of the currency pair:
Prev Open: 1.12141
Open: 1.12604
% chg. over the last day: +0.32
Day’s range: 1.12551 – 1.12692
52 wk range: 1.1214 – 1.2557
EUR\USD started to grow. Yesterday the quotes increased by 50 points and updated the local maximums. This is mostly caused by technical factors as the investors begin to fix their positions before the European Central Bank meeting and the EU summit. Right now the quotes are consolidating around 1.12500-1.12750, with a tendency for further growth. You should open positions from the key levels and track the relevant information regarding the US\China negotiations.
The Economic News Feed for 08.04.2019 is calm.
Job Openings and Labor Turnover Survey (US) – 17:00 (GMT+3:00);
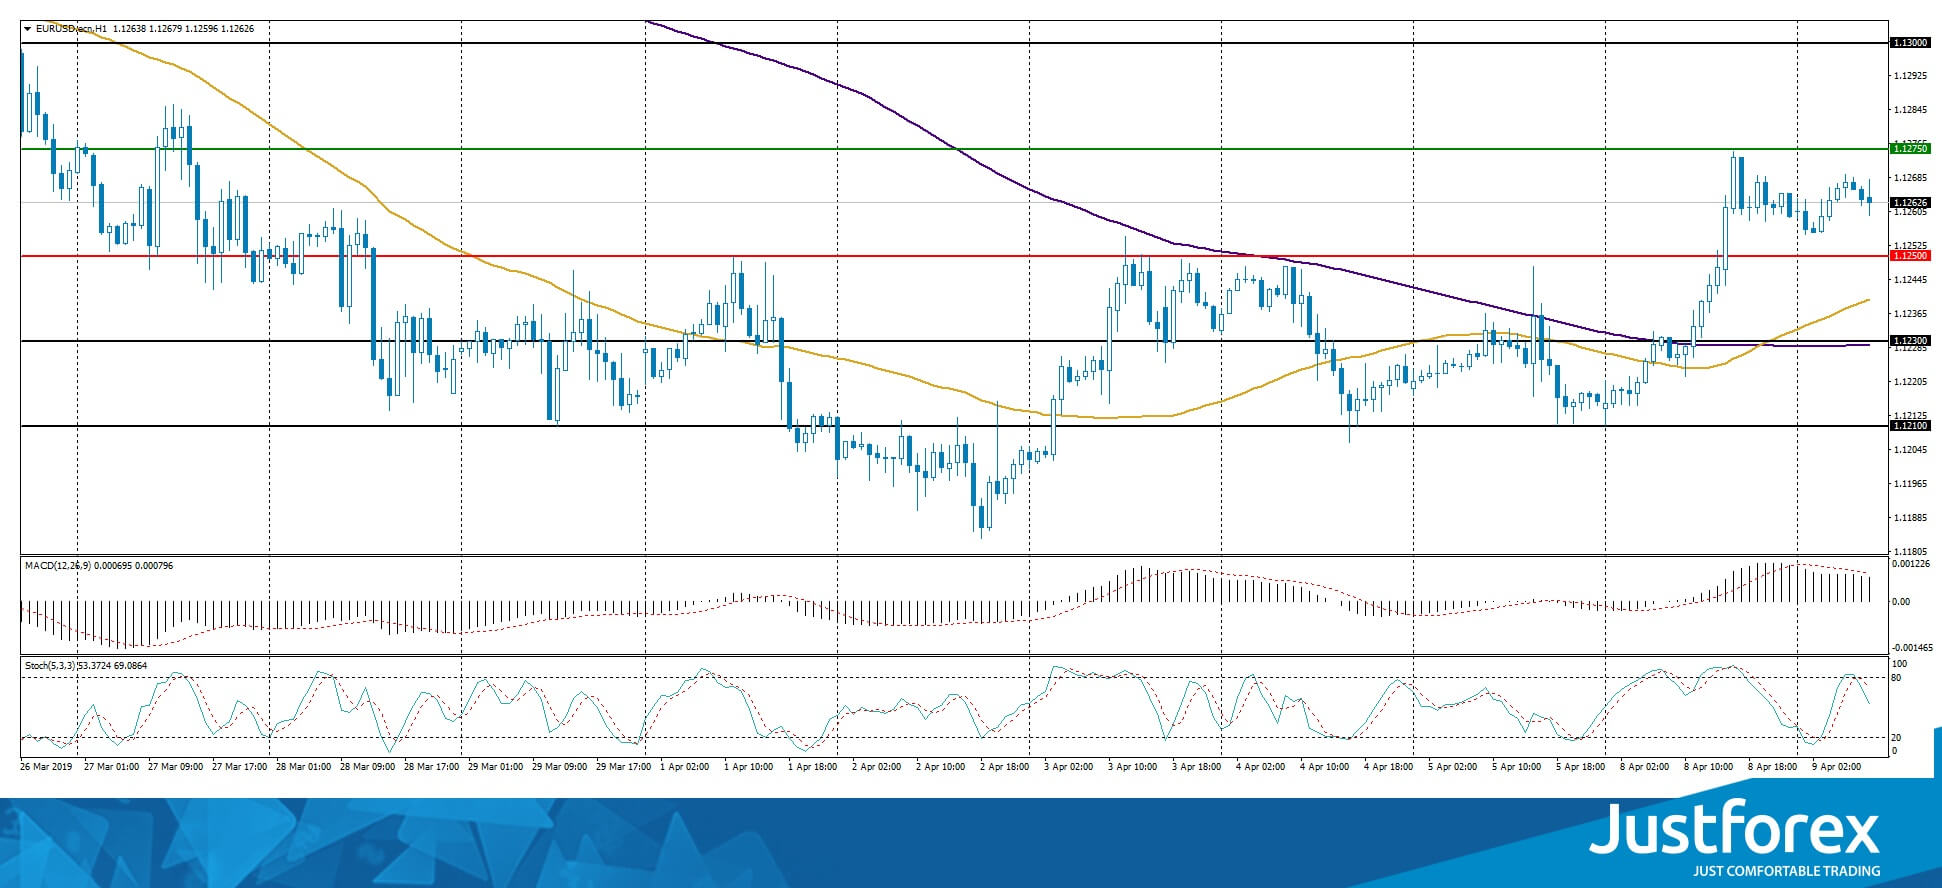
The price fixed above 50 MA and 200 MA which points to the power of the buyers.
The MACD histogram is in the positive zone but below the signal line which gives a weak signal to buy EUR\USD.
The Stochastic Oscillator is in the neutral zone, the %K line is below the %D line which points to the bearish mood.
Trading recommendations
Support levels: 1.12500, 1.12300, 1.12100
Resistance levels: 1.12750, 1.13000
If the price fixes at 1.12750, expect the quotes to recover toward 1.13000-1.13250.
Alternatively, the quotes can recover toward 1.12300-1.12200.
The GBP/USD currency pair
Technical indicators of the currency pair:
Prev Open: 1.30350
Open: 1.30560
% chg. over the last day: +0.18
Day’s range: 1.30490 – 1.30950
52 wk range: 1.2438 – 1.4378
GBP\USD stabilized next to the 1.31000 mark. The technical picture is ambiguous. Investors are waiting before the EU summit. On Wednesday, April 10, the EU will make a final decision regarding the Brexit delay, which is currently set to Friday. Keep an eye on this issue and open positions from the key levels of 1.30550 and 1.31000.
The Economic News Feed for 09.04.2019 is calm.
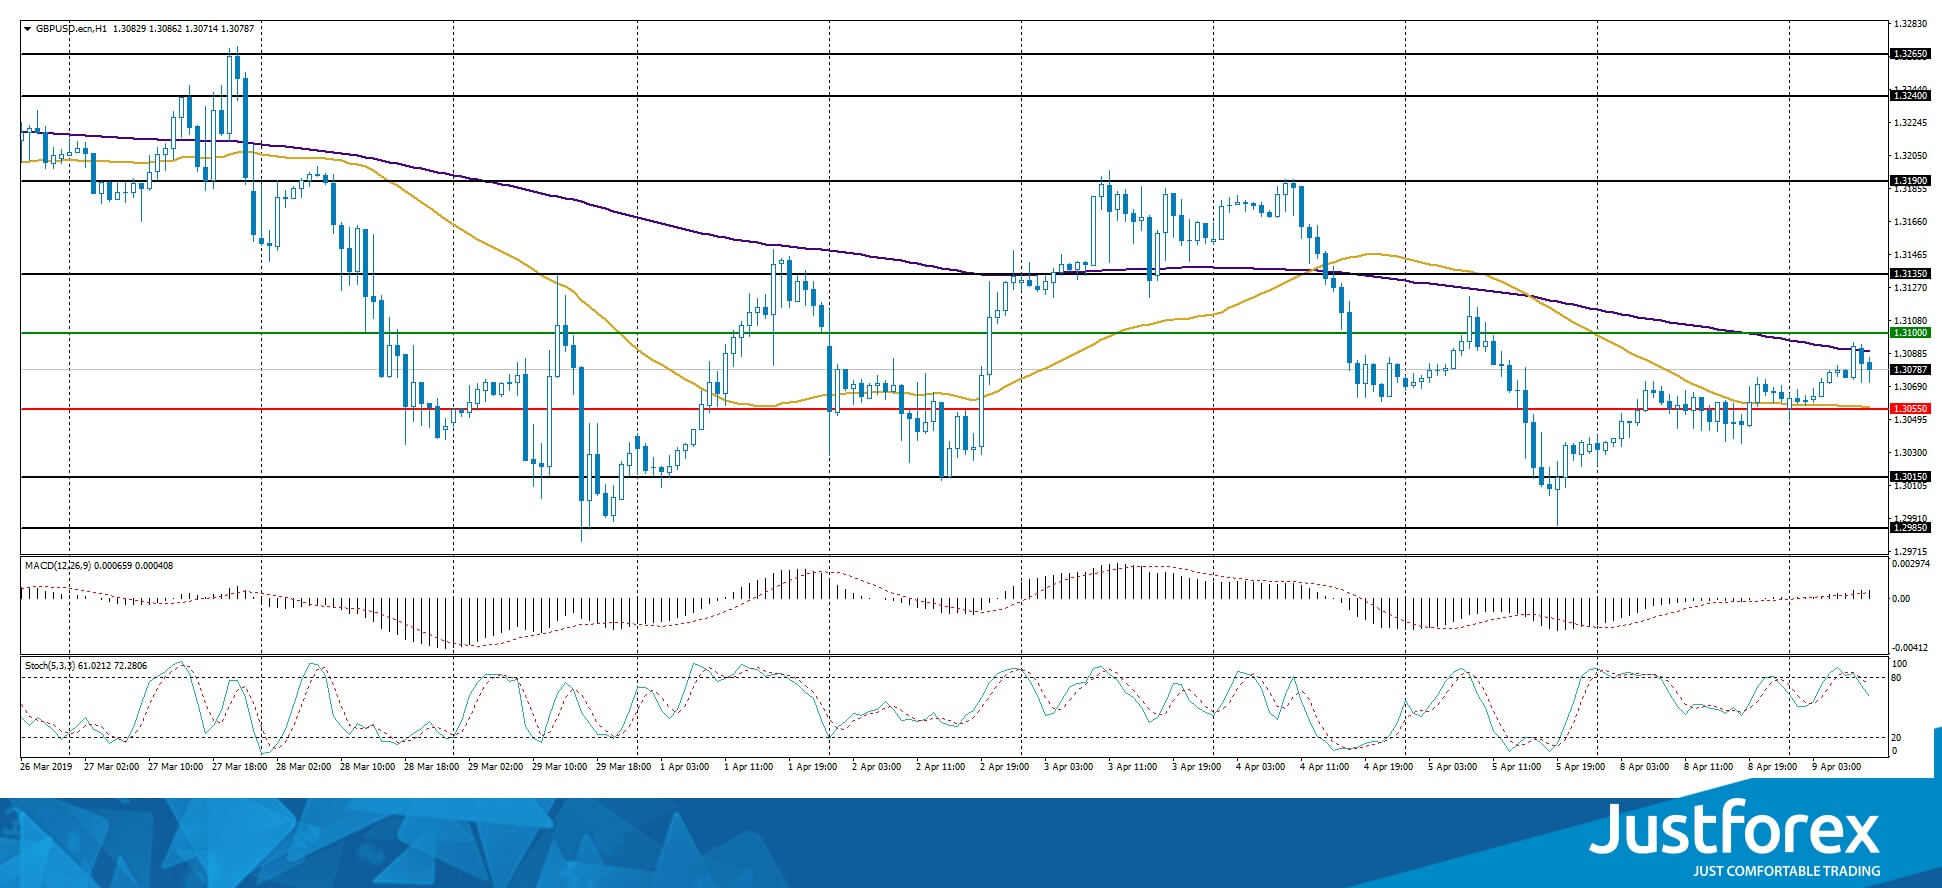
The indicators do not provide any signals, the price has crossed 50 MA and 200 MA.
The MACD histogram is in the positive zone which points to the bullish mood.
The Stochastic Oscillator started to leave the overbought zone, the %K line is below the %D line which points to the bearish mood.
Trading recommendations
Support levels: 1.30550, 1.30150, 1.29850
Resistance levels: 1.31000, 1.31350, 1.31900
If the quotes fix above 1.31000, expect further fall toward 1.31350-1.31500.
Alternatively, the quotes can grow toward 1.30200-1.30000.
The USD/CAD currency pair
Technical indicators of the currency pair:
Prev Open: 1.33819
Open: 1.33103
% chg. over the last day: -0.46
Day’s range: 1.32934 – 1.33193
52 wk range: 1.2248 – 1.3664
Aggressive sales were observed on the USD/CAD yesterday. The quotes fell by 70 points. Trading instrument updated the key minimums. The demand for commodity currencies is supported against the background of positive dynamics of oil prices. At the moment, USD/CAD is testing the 1.33000. 1.33250 is the nearest resistance. The USD/CAD currency pair has the prospects to decline further. You should open positions from key levels.
The newsfeed is calm for today.
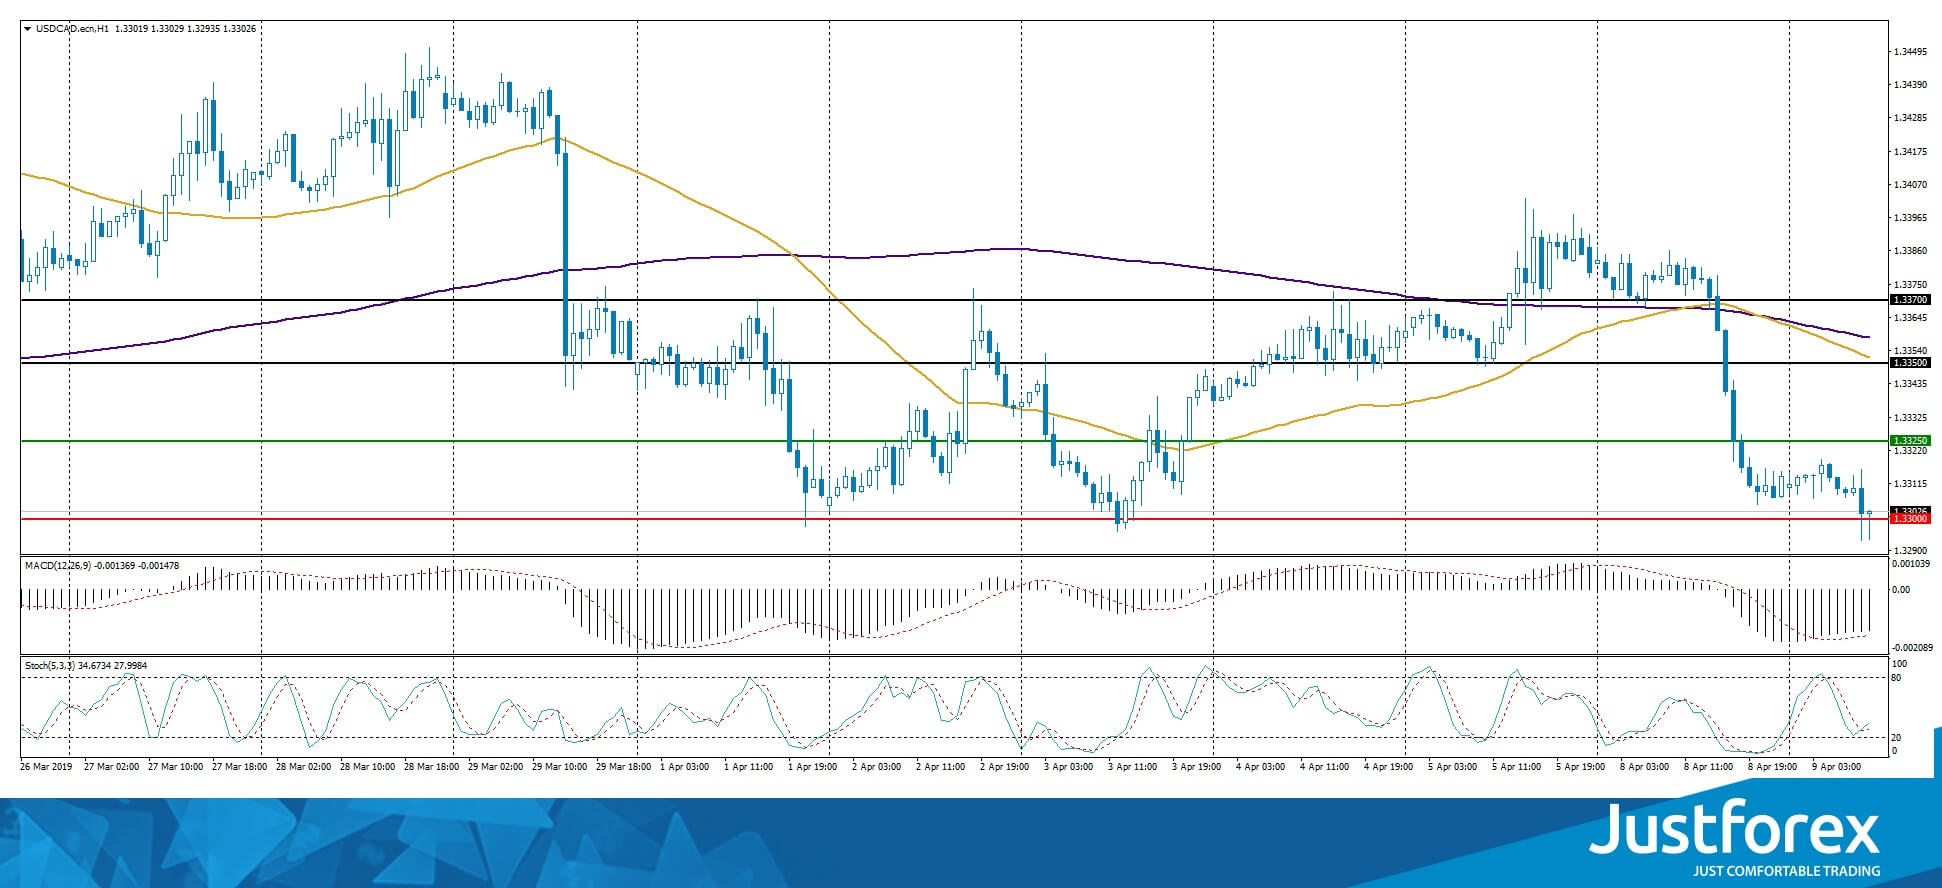
The price fixed below 50 MA and 200 MA, which points to the power of the sellers.
The MACD histogram is in the negative zone but above the signal line which gives a weak signal to buy USD\CAD
The Stochastic Oscillator is in the neutral zone, the %K line is crossing the %D line. There are no signals at the moment.
Trading recommendations
Support levels: 1.33000, 1.32500
Resistance levels: 1.33250, 1.33500, 1.33700
If the price fixes below 1.33000, the price is expected to fall toward 1.32600-1.32400.
Alternatively, the quotes can grow toward 1.33500-1.33700.
The USD/JPY currency pair
Technical indicators of the currency pair:
Prev Open: 111.666
Open: 111.457
% chg. over the last day: -0.23
Day’s range: 111.279 – 111.579
52 wk range: 104.56 – 114.56
USD/JPY is moving sideways. There is no single defined trend. Right now the quotes are testing the 111.300-111.150 demand zone. The resistance is at 111.550. A technical correction is possible soon. Keep an eye on the US Treasury bonds’ yield and open the positions from the key levels.
The Economic News Feed for 09.04.2019 is calm.
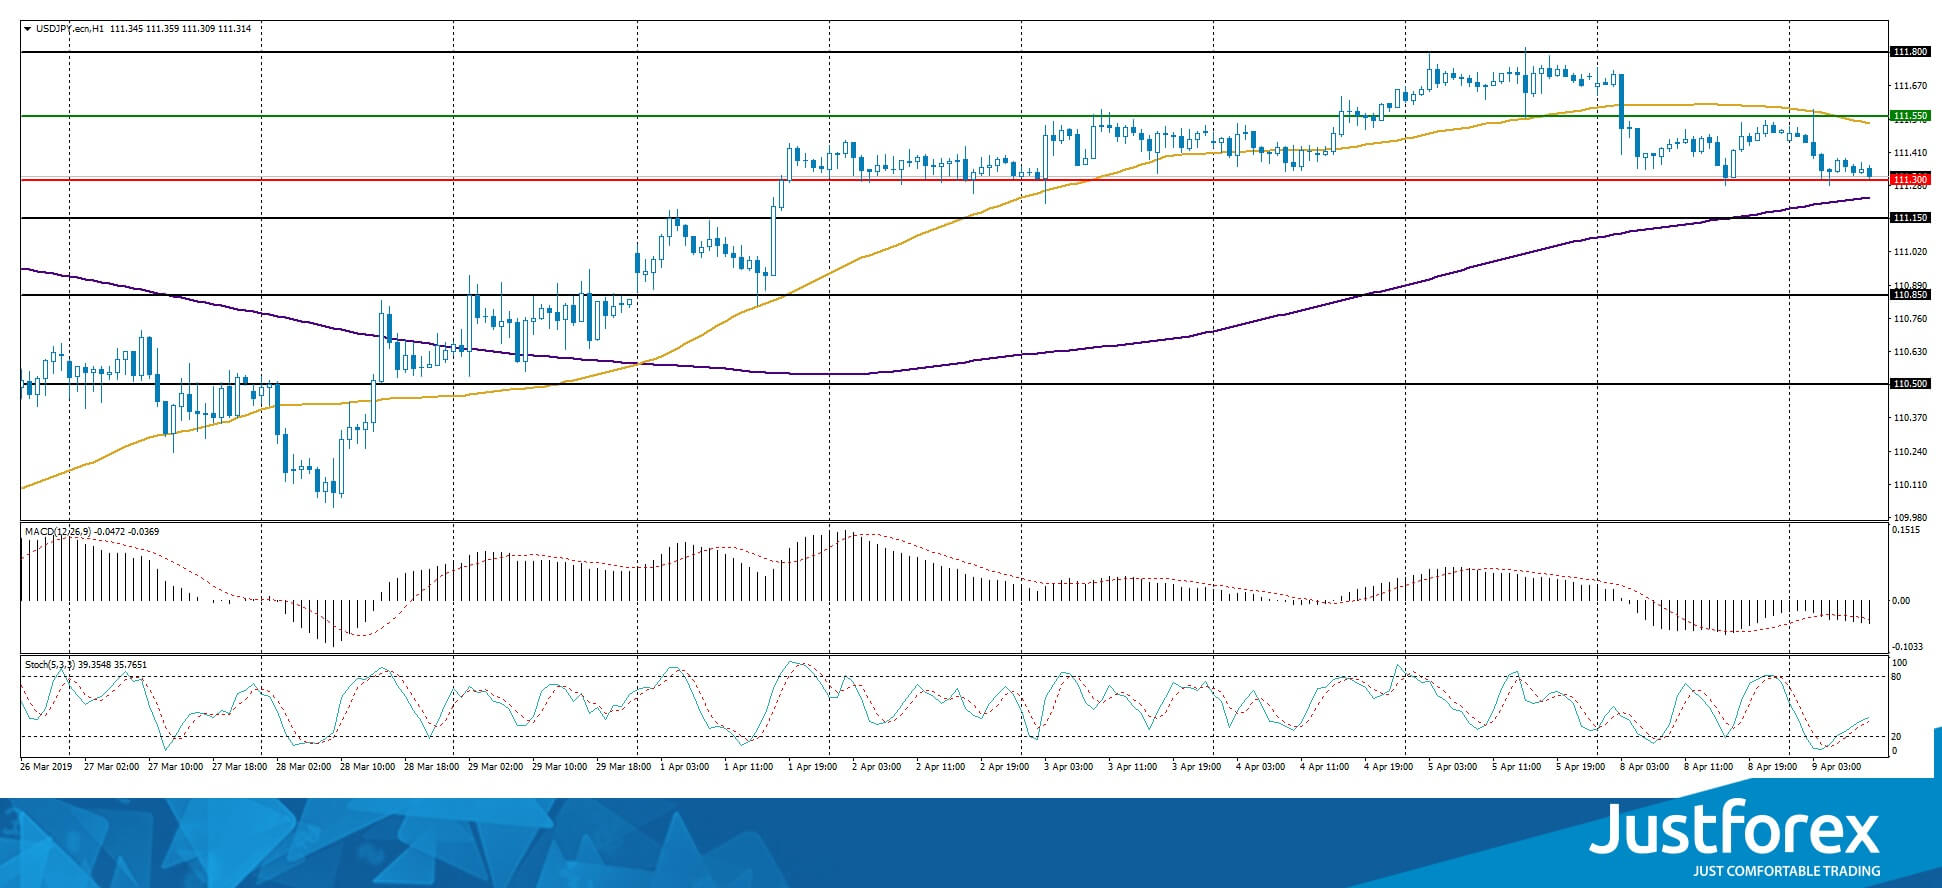
The indicators do not provide precise signals, the price fixed between 50 MA and 200 MA.
The MACD histogram is in the negative zone and below the signal line which gives a strong signal to buy USD/JPY.
The Stochastic Oscillator is in the neutral zone, the %K line is above the %D line which points to the bullish mood.
Trading recommendations
Support levels: 111.300, 111.150, 110.850
Resistance levels: 111.550, 111.800, 112.000
If the price fixes above 111.300, expect further growth toward 111.000-110.800.
Alternatively, the quotes can fall toward 111.700-112.000.


