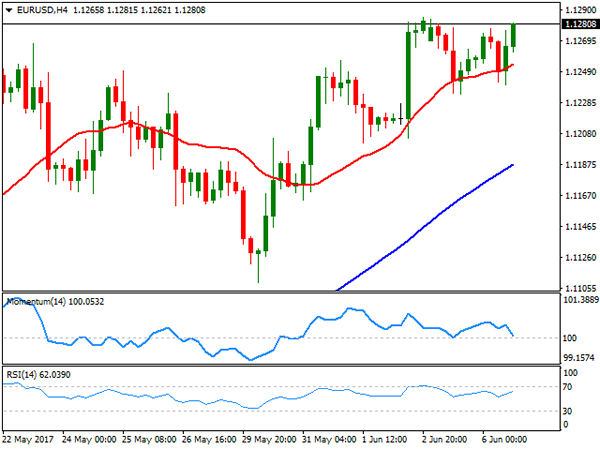
EUR/USD
Majors had quite an active day, although the common currency saw little action against the greenback. The EUR/USD pair traded within a tight 40 pips range this Tuesday, ending it higher, and a couple of pips below its yearly high. The cautious stance ahead of the ECB prevailed alongside with broad dollar’s weakness. Risk aversion was a theme, following news that several Middle East countries cut ties with Qatar, accusing this last of backing religious extremism, and leading to equities’ losses worldwide, and sharp gains in safe-havens yen and gold.
In the data front and specifically for the EUR/USD pair, the Euro Area released April Retail Sales figures, presenting a modest uptick in the month that missed expectations. Sales rose by 0.1% when compared to March, and by 2.5% when compared to a year earlier, while a local investors’ confidence index up to 28.4 from previous 27.4 for June, in line with latest growth supportive data in the region.
The technical picture keeps favoring the upside, as intraday buying interest surged on approaches to the 20 SMA in the 4 hours chart, while the RSI indicator maintains its upward slope, currently at 59. The Momentum indicator in the same time frame eased towards its mid-line, rather reflecting the limited interest around the pair than suggesting an upcoming slide. Holding at highs, the pair needs to break through 1.1299, the high posted as an immediate reaction to US election outcome, to be able to extend its advance towards 1.1460 a long term strong static resistance.
Support levels: 1.1220 1.1180 1.1125
Resistance levels1.1300 1.1345 1.1390
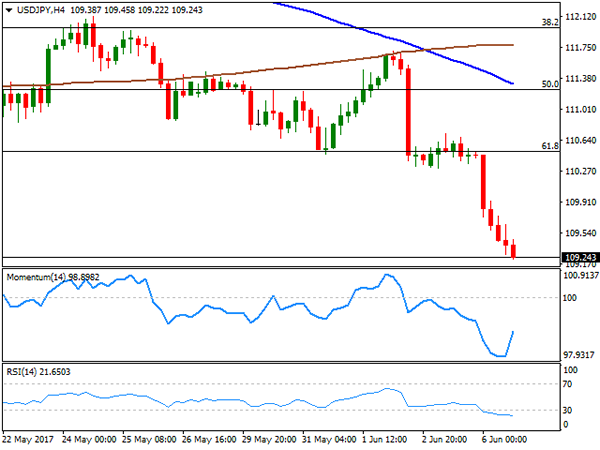
USD/JPY
The USD/JPY pair entered a selling spiral this Thursday, trading at fresh 2-month lows ahead of the Asian opening near 109.20, with the Japanese yen benefited by a risk-averse environment. Tensions in the Middle East coupled with critical events later this week, which include former FBI director Comey testimony before the Senate intelligence committee. Bonds were on demand, resulting ht eh 10-year note benchmark falling down to 2.129% intraday, its lowest since the US presidential election last November. Japan will release its preliminary April leading index during the upcoming Asian session, although seems more than likely that the pair will continue to react to sentiment. Technically, the pair is now poised to retest this year low set last month at 108.12, although some consolidation could be expected ahead of another leg lower. In the 4 hours chart, the price is now developing well below its 100 and 200 SMAs, with the shortest accelerating below the largest, whilst the RSI indicator continues heading lower, despite being at 22, while the Momentum indicator turned strongly higher, still within positive territory, this last showing decreasing selling interest at this point.
Support levels: 109.20 108.85 108.50
Resistance levels: 109.75 110.10 110.50
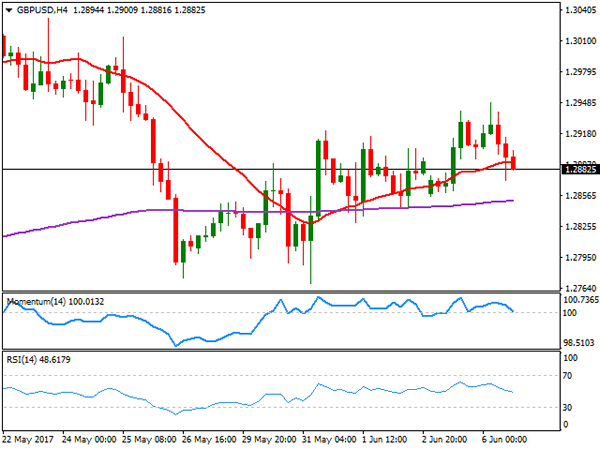
GBP/USD
The GBP/USD pair retreated from a fresh weekly high of 1.2949 achieved early Asia to end the day in the red and in the 1.2880 region, flat for the week. Poll’s headlines kept leading the way for Pound, with the latest showing that the Labour party keeps closing the gap on Conservatives, these lasts barely 1 point ahead on intention vote. Also, a YouGov opinion model showed that May’s Conservative party is likely to fall 22 seats short of majority in the upcoming June 8th election, all of which weighs on Pound. If the slide is contained, is just because dollar’s broad weakness. From a technical point of view, intraday readings favor the downside, given that in the 4 hours chart, the price has settled below its 20 SMA, whilst technical indicators are crossing their mid-lines, entering negative territory. The pair has an immediate support at 1.2840, a magnet level for these past two weeks, while a break below 1.2800 is required to confirm a new leg lower that can extend down to the 1.2750/60 price zone.
Support levels: 1.2840 1.2800 1.2760
Resistance levels: 1.2920 1.2950 1.3000
GOLD
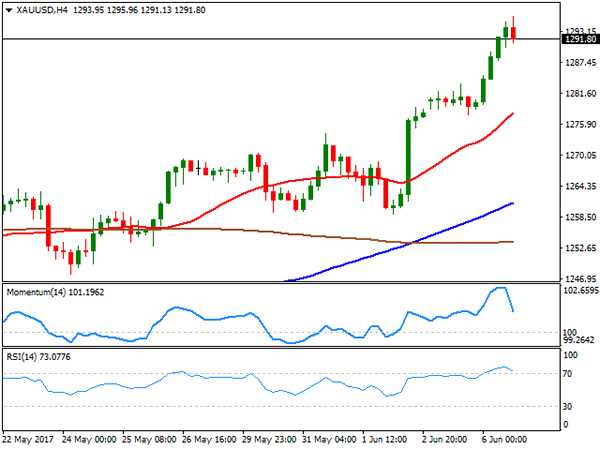
Spot gold surpassed its previous 2017 high by a few cents this Tuesday, as political uncertainty fueled demand for the safe-haven commodity. Gold traded as high as $1,295.96 a troy ounce before retreating modestly, to settle at 1,291.40, still sharply higher on the day. Mounting geopolitical tensions in the Middle East alongside with cautious mood ahead of the upcoming US ex-FBI director Comey before the US Senate, favored the bright metal. Having stalled below the 1,300.00 threshold, the risk is clearly towards the upside according to technical readings, given that in the daily chart, the 20 SMA heads north well below the current level and above the 100 and 200 SMAs, whilst technical indicators turned north, with the RSI at a fresh 2-month high around 68. Shorter term, and according to the 4 hours chart, the upside is also favored, as the 20 SMA gathered upward momentum well below the current level, whilst technical indicators have eased from extreme overbought readings, but remain well into positive territory, and far from suggesting an upcoming downward corrective move.
Support levels: 1,287.80 1,276.60 1,266.90
Resistance levels: 1,295.90 1,303.10 1311.80
WTI CRUDE OIL
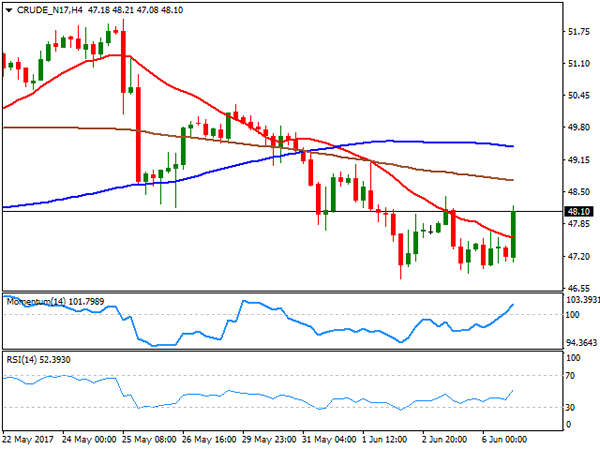
Crude oil prices edged higher on Tuesday, with West Texas Intermediate crude futures ending the day at $48.10 a barrel, as despite tensions in the Middle East, traders are looking forward, pricing in another weekly draw-down in oil stockpiles. The EIA report is expect to show a 3.4 million barrels’ drop for the week ended June 2nd. In the meantime the US Energy Information raised its U.S. production outlook for 2018, according to a monthly report issued this Tuesday, up to 10.01 million barrels a day for the year, up 0.4% from the previous outlook, which should keep gains in check, despite the ongoing turmoil in the energy market. Technically, the daily chart shows that the recovery stalled below Monday’s intraday high, whilst the price keeps developing far below its moving averages, as technical indicators consolidate within bearish territory, all of which maintains the risk towards the downside. In the 4 hours chart, the price settled above a bearish 20 SMA, but remains below the 100 and 200 SMAs, whilst technical indicators lost upward momentum after entering positive territory, indicating decreasing buying interest at this point.
Support levels: 47.90 47.20 46.65
Resistance levels: 48.60 49.30 50.10
DJIA
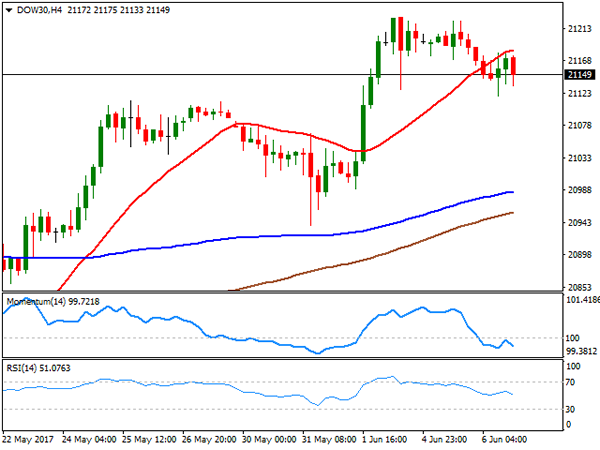
US equities edged lower this Tuesday, weighed by political woes denting investors’ mood and with retailers suffering the most. The Dow Jones Industrial Average lost 47 points and settled at 21.136.23, while the Nasdaq Composite lost 0.33%, to 6,257.06. The S&P lost 6 points and closed the day 2,429.33. Wall Street followed the lead of its overseas counterparts, down on Middle East tensions, weighed additionally by mounting concerns over Trump’s leadership, ahead of former FBI director Comey testimony before a Senate special committee. Wall-Mart led declines within the Dow, shedding 1.67%, followed by Boeing that closed 1.12% lower. Exxon Mobile was the best performer, up 1.30%, followed by Chevron that added 0.3%. The daily chart for the Dow shows that technical indicators have retreated modestly, but are still well above their mid-lines, whist the index keeps developing above its moving averages. In the 4 hours chart, the scale leans towards the downside, as technical indicators head south below their mid-lines, whilst intraday advances were contained by selling interest around the 20 SMA.
Support levels: 21,125 20,080 20,041
Resistance levels: 21,184 21,228 21,260
FTSE100
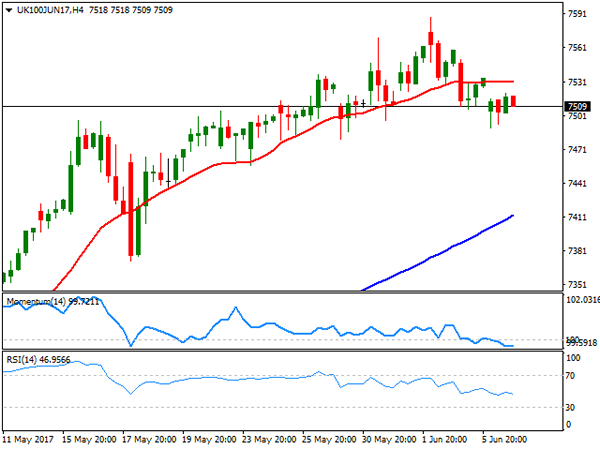
The FTSE 100 closed the day virtually unchanged at 7,524.95, down 0.01%. Sharp losses from ConvaTec, down by 3.95%, after two investors sold a stake in the firm and Burberry that shed 3.7% after HSBC cut its rating on the company to "reduce" from "hold" were offset by soaring mining-related equities. Fresnillo topped gainers list, up 3.21%, followed by Randgold Resources that added 2.67%, and Anglo American, up by 1.85%. A weaker Pound by the end of the day, help maintaining the index afloat. The daily chart for the index shows that it fall further towards a bullish 20 SMA, holding near its weekly lows, as technical indicators keep retreating within positive territory, in line with further declines. In the 4 hours chart, technical readings present a neutral-to-bearish stance, as the index stands right below a horizontal 20 SMA, whilst technical indicators present modest bearish slopes within neutral territory.
Support levels: 7,492 7,457 7,405
Resistance levels: 7,541 7,588 7,620
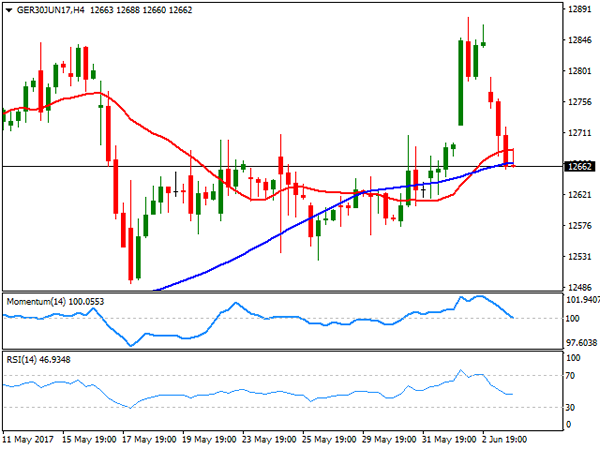
DAX
The German DAX fell 131 points or 1.04%, ending the day at 12,690.12 as risk aversion led equity traders ever since Monday’s headlines announcing geopolitical woes in the Middle East. Healthcare equities were among the worst performers, while mining-related ones led advancers. Within the DAX, only five components closed with gains, with RWE AG leading winners’ list with a 2.99% advance, followed by E.ON that added 2.22%. Volkswagen led decliners with a 2.07% lost, followed by Deutsche Bank that shed 1.98% and Bayer, down 1.80%. The daily chart for the index shows that it extended its slide in after hours trading, now standing a few pips below a horizontal 20 DMA, whilst the RSI indicator heads south around 53 as the Momentum retreats from its 100 line, both anticipating additional declines. Shorter term, and according to the 4 hours chart, the downward risk is also present, as the index is trading right below its 20 and 100 SMAs, whist technical indicators are crossing their mid-lines into negative territory.
Support levels: 12,620 12,575 12,521
Resistance levels: 12,707 12,760 12,810