
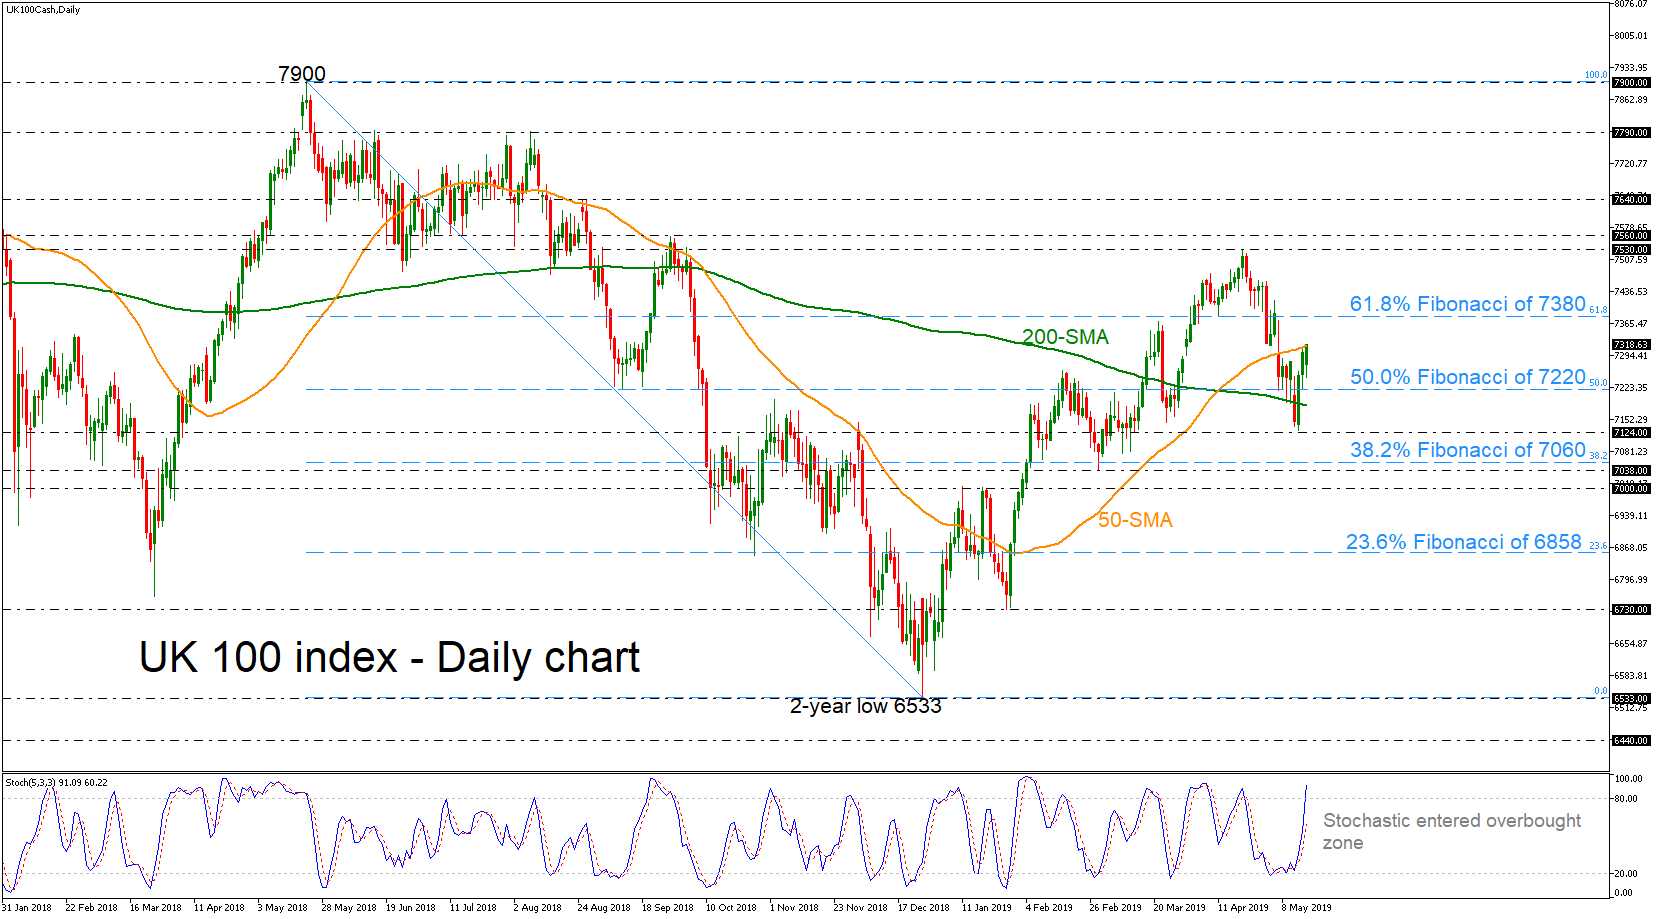
UK 100 stock index (FTSE 100) has advanced considerably over the last couple of days after touching the 7124 support, remaining below the 50-day average. The stochastic oscillator is confirming this view, as it is heading north, approaching the overbought territory.
If the price manages more bullish actions and surpasses successfully the 50-SMA, immediate resistance would come from the 61.8% Fibonacci retracement level of the downleg from 7900 to 6533 around 7380. Further up, the index could rest around the 7530-7560 resistance area.
On the other hand, in case of bearish structure the market might revisit the 50.0% Fibonacci of 7220, which stands slightly above the 200-SMA. More declines could meet the 7124 support and the 38.2% Fibonacci of 7060.
Overall, a jump above the 61.8% Fibonacci again could confirm the near-term bullish tendency in the daily chart.


