
A note on lower timeframe confirming price action…
Waiting for lower timeframe confirmation is our main tool to confirm strength within higher timeframe zones, and has really been the key to our trading success. It takes a little time to understand the subtle nuances, however, as each trade is never the same, but once you master the rhythm so to speak, you will be saved from countless unnecessary losing trades. The following is a list of what we look for:
- A break/retest of supply or demand dependent on which way you’re trading.
- A trendline break/retest.
- Buying/selling tails … essentially we look for a cluster of very obvious spikes off of lower timeframe support and resistance levels within the higher timeframe zone.
- Candlestick patterns. We tend to only stick with pin bars and engulfing bars as these have proven to be the most effective.
We typically search for lower-timeframe confirmation between the M15 and H1 timeframes, since most of our higher-timeframe areas begin with the H4. Stops are usually placed 1-3 pips beyond confirming structures.
EUR/USD
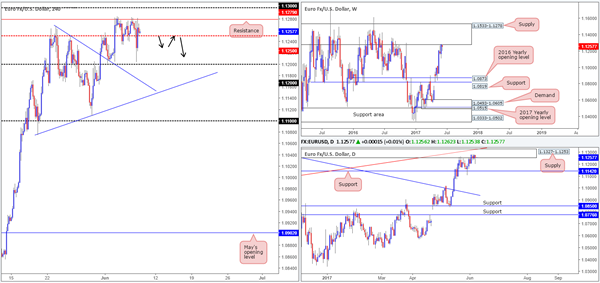
For those who read Wednesday’s report you may remember us mentioning that we had taken a short position from 1.1282, and were looking to target the H4 mid-level support at 1.1250 as the initial take-profit zone. As you can see, the trade worked out nicely and hit 1.1250. Unfortunately, we moved our stop to breakeven following this and were taken out shortly after.
Despite H4 price trading back above 1.1250, we still feel the bears have general control of this market, at least from a technical standpoint. This is due to seeing the single currency not only trading around the underside of a weekly supply at 1.1533-1.1278, but also a daily supply, which is glued to the underside of the weekly zone at 1.1327-1.1253.
Our suggestions: To prove seller interest remains, we’d like to see a decisive H4 close form below 1.1250. This – coupled with a retest of 1.1250 and a reasonably sized H4 bear candle (preferably a full-bodied candle) would, in our humble opinion, be enough to begin considering shorts down to 1.1200, and possibly the daily support at 1.1142.
Data points to consider: EUR Minimum bid rate at 12.45pm, ECB Press conference at 1.30pm. US Unemployment claims at 1.30pm GMT+1.
Levels to watch/live orders:
- Buys: Flat (stop loss: N/A).
- Sells: Watch for H4 price to engulf 1.1250 and then look to trade any retest seen thereafter ([waiting for a reasonably sized H4 bear candle to form following the retest is advised] stop loss: ideally beyond the candle’s wick).
GBP/USD:
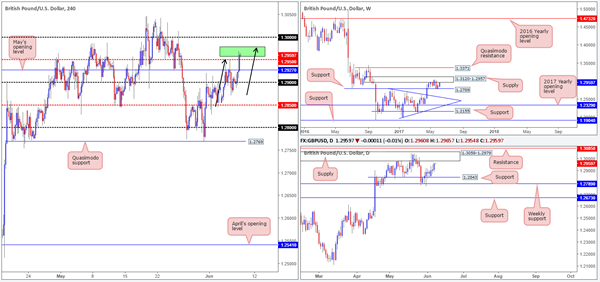
In yesterday’s report we noted the 1.2957/1.2979 area (marked in green on the H4 chart) was of interest. This is due to this zone being formed by the underside of both weekly and daily supplies. In addition to this, there’s also a nearby H4 AB=CD bearish completion point seen within the green zone taken from the low 1.2845.
As you can see, H4 price is currently trading inside the said green zone and the bears are beginning to make an appearance. Be that as it may, the UK electorate goes to the polls today and this will likely have a marked effect on this pair and could potentially destabilize this technical setup.
Our suggestions: Given the UK elections today, we will not be taking any setups, be it long or short, on GBP-related pairs today, and probably even tomorrow. ‘Acting in your own best interest’ is key to success in this business and sometimes the best position is NO position.
Data points to consider: UK elections (all day). US Unemployment claims at 1.30pm GMT+1.
Levels to watch/live orders:
- Buys: Flat (stop loss: N/A).
- Sells: Flat (stop loss: N/A).
AUD/USD
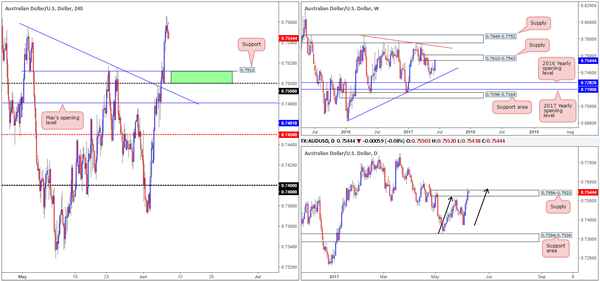
Looking at this market from the top this morning, we can see that weekly price is currently teasing the underside of supply penciled in at 0.7610-0.7543. In conjunction with weekly flow, daily action recently whipsawed above supply formed at 0.7556-0.7523 and touched base with an AB=CD bearish completion point (see black arrows) at 0.7563 taken from the low 0.7328.
In view of the higher-timeframe picture, we believe the H4 candles will continue to push lower today and possibly connect with the 0.75/0.7512 zone seen marked in green. If you look on the M15 timeframe, there was an absolutely beautiful shorting opportunity on the break/retest of a trendline support taken from the low 0.7545. We unfortunately missed this setup, but well done to any of our readers who managed to catch it!
Our suggestions: With the bigger picture indicating that shorts may take control, we will continue to watch the lower timeframes for possible shorting opportunities today, with an initial target zone set at 0.75/0.7512.
Data points to consider: Aussie Trade balance figures at 2.30am, Chinese Trade balance data (tentative). US Unemployment claims at 1.30pm GMT+1.
Levels to watch/live orders:
- Buys: Flat (stop loss: N/A).
- Sells: Currently watching for lower-timeframe shorting opportunities.
USD/JPY
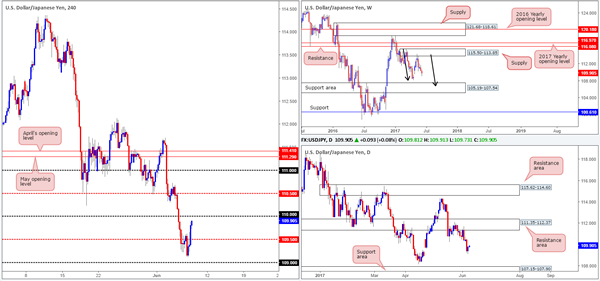
In recent sessions, the USD/JPY recovered from just ahead of the 109 handle and ran through offers at the H4 mid-level resistance drawn from 109.50. Right now, the pair looks poised to attack the 110 handle which could very well hold as resistance today. Be that as it may, the H4 mid-level resistance seen above at 110.50 is, in our opinion, a far more attractive line given how well it held as support throughout May (see green arrows).
Weekly bears continue to remain in a relatively strong position after pushing aggressively lower from supply registered at 115.50-113.85. We know there’s a lot of ground to cover here, but this move could possibly result in further downside taking shape in the form of a weekly AB=CD correction (see black arrows) that terminates within a weekly support area marked at 105.19-107.54 (stretches all the way back to early 2014). In conjunction with weekly flow, daily price also shows a potential AB=CD correction in the works taken from the high 114.36, which could see price drive lower to 107.15-107.90: a support zone that’s glued to the top edge of the said weekly support area.
Our suggestions: With the above notes in mind, our desk remains biased to the downside. With that, both 110 and 110.50 are possible levels to sell from. To prove seller interest, however, we would advise waiting for a reasonably sized H4 bearish candle to take shape, preferably a full-bodied candle.
Data points to consider: US Unemployment claims at 1.30pm GMT+1
Levels to watch/live orders:
- Buys: Flat (stop loss: N/A).
- Sells: 110 region ([waiting for a reasonably sized H4 bear candle – preferably a full-bodied candle – to form before pulling the trigger is advised] stop loss: ideally beyond the candle’s wick). 110.50 ([waiting for a reasonably sized H4 bear candle – preferably a full-bodied candle – to form before pulling the trigger is advised] stop loss: ideally beyond the candle’s wick).
USD/CAD
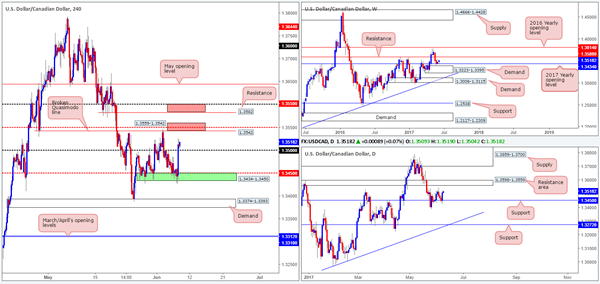
As can be seen from the H4 chart this morning, the market bounced beautifully from the 1.3434-1.3450 green area during yesterday’s trading. The zone is comprised of a 2017 yearly opening level at 1.3434 seen on the weekly chart and the H4 mid-level support pegged at 1.3450 which also represents a support level seen on the daily chart.
The advance seen from the said (green) zone has lifted the currency above the 1.35 handle, with H4 price now seen trading within striking distance of a broken Quasimodo line at 1.3542, followed closely by a mid-level resistance penciled in at 1.3550. These two levels, coupled with the underside of a daily resistance area at 1.3559 forms a potential zone for a bounce (lower red zone). However, it might be worth noting that the H4 resistance seen above this area at 1.3582 could also be targeted given that it’s positioned so closely to weekly resistance visible at 1.3588.
Our suggestions: Watch for lower-timeframe confirmed (see the top of this report) shorting opportunities around 1.3559-1.3542. Should this area be engulfed, however, we’ll then shift our focus up to 1.36/1.3582 (the upper red zone on the H4 chart).
Data points to consider: US Unemployment claims at 1.30pm. BoC Gov. Poloz speaks at 4.15pm GMT+1.
Levels to watch/live orders:
- Buys: Flat (Stop loss: N/A).
- Sells: 1.3559-1.3542 ([waiting for a lower-timeframe sell signal to form before pulling the trigger is advised] stop loss: dependent on where one confirms this area). 1.36-1.3582 ([waiting for a lower-timeframe sell signal to form before pulling the trigger is advised] stop loss: dependent on where one confirms this area).
USD/CHF
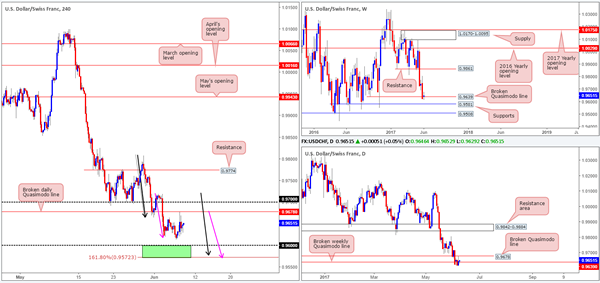
As you can see on the weekly timeframe, the buyers and sellers are behaving somewhat indecisively around the weekly Quasimodo point at 0.9639.The next downside target beyond this hurdle is seen around a support level drawn from 0.9581. Looking down to the daily chart, price recently attacked the underside of a broken Quasimodo line pegged at 0.9678, which we feel could be enough to push H4 price lower into the 0.9572/0.96 region.
This green area marked on the H4 chart is formed by a psychological support handle at 0.96 and a H4 AB=CD (see black arrows) 161.8% bullish completion point at 0.9572. In addition to this, we can also see another H4 AB=CD move possibly in play that terminates around the lower edge of the said green zone (taken from the high 0.9719 – see pink arrows).
Our suggestions: Wait for H4 price to attack 0.9572/0.96 and watch to see if the H4 candles can print a reasonably sized bull candle, preferably a full-bodied candle, before pushing the buy button. This, of course, will by no means guarantee a winning trade, but it will help determine buyer interest and help avoid an unnecessary loss! The first take-profit target from this base will be set around the 0.9650 area.
Data points to consider: US Unemployment claims at 1.30pm GMT+1.
Levels to watch/live orders:
- Buys: 0.9572/0.96 ([waiting for a reasonably sized H4 bull candle – preferably a full-bodied candle – to form before pulling the trigger is advised] stop loss: ideally beyond the candle’s tail).
- Sells: Flat (stop loss: N/A).
DOW 30
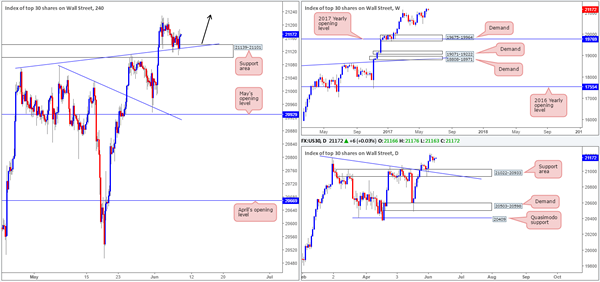
On Wednesday, we mentioned that our desk had taken a small long position at 21164 and placed stops below the H4 support area (21139-21101) at 21097. The position is still active since yesterday’s action spent the majority of the day clinging to the top edge of the said H4 support zone, which , as you can probably see, converges with a H4 trendline support etched from the high 21072.
We see absolutely no higher-timeframe resistance ahead, so fresh record highs are what we expect to be seen before the week’s end.
Our suggestions: Essentially, what we’re looking for here is trend continuation.
Data points to consider: US Unemployment claims at 1.30pm GMT+1.
Levels to watch/live orders:
- Buys: 21164 ([live] stop loss: 21097).
- Sells: Flat (stop loss: N/A).
GOLD:
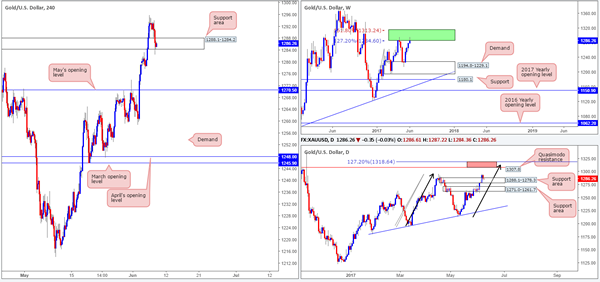
The yellow metal, as expected, has begun turning lower from within an area comprised of two weekly Fibonacci extensions 161.8/127.2% at 1313.7/1285.2 taken from the low 1188.1 (green zone). Similar to when price struck this zone back in mid-April, we expect the bears to drag price action lower from here in the weeks to come.
The story on the daily chart, nevertheless, shows that price is currently retesting a support area formed at 1288.1-1278.3. Provided that this area remains stable, the unit could approach the Quasimodo resistance at 1307.8. Also noteworthy is the possible AB=CD daily bearish pattern (see black arrows) that terminates a tad beyond the said Quasimodo resistance (positioned within the upper limits of the weekly green zone) at 1318.6 (127.2% ext.).
Looking over to the H4 chart, the support area at 1288.1-1284.2 was, in recent hours, breached, but is still managing to hold ground for the time being. It also might be worth acknowledging that this H4 zone is housed within the walls of the daily support area mentioned above at 1288.1-1278.3.
Our suggestions: Unfortunately, we feel this is a risky market to participate in at the moment. A long from the current H4 support area, even though it’s bolstered by a daily zone, is chancy knowing where price is positioned on the weekly timeframe. The same, of course, goes for shorts. Selling into the above noted support areas, even with knowing that weekly price is trading within a sell zone would, in our opinion, is still considered too risky.
However, we’re still watching for the daily candles to test the aforementioned Quasimodo resistance/127.2% AB=CD completion area (red zone) as it is (given its location on the weekly chart) an ideal sell zone, in our opinion.
Levels to watch/live orders:
- Buys: Flat (stop loss: N/A).
- Sells: 1318.6/1307.8 is a potential sell zone to keep an eye on.


