
Key Highlights
- The British Pound declined heavily and broke the key 1.2870 support against the US Dollar.
- GBP/USD traded below a crucial triangle support at 1.2995 to start a sharp decline.
- The Chicago Fed National Activity Index in April 2019 declined from 0.05 to -0.45.
- The US Existing Home Sales might increase 2.6% in April 2019 (MoM).
GBPUSD Technical Analysis
This past week, the British Pound struggled to stay above the key 1.3000 support area against the US Dollar. As a result, the GBP/USD pair declined heavily below the 1.2920, 1.2870 and 1.2800 support levels.
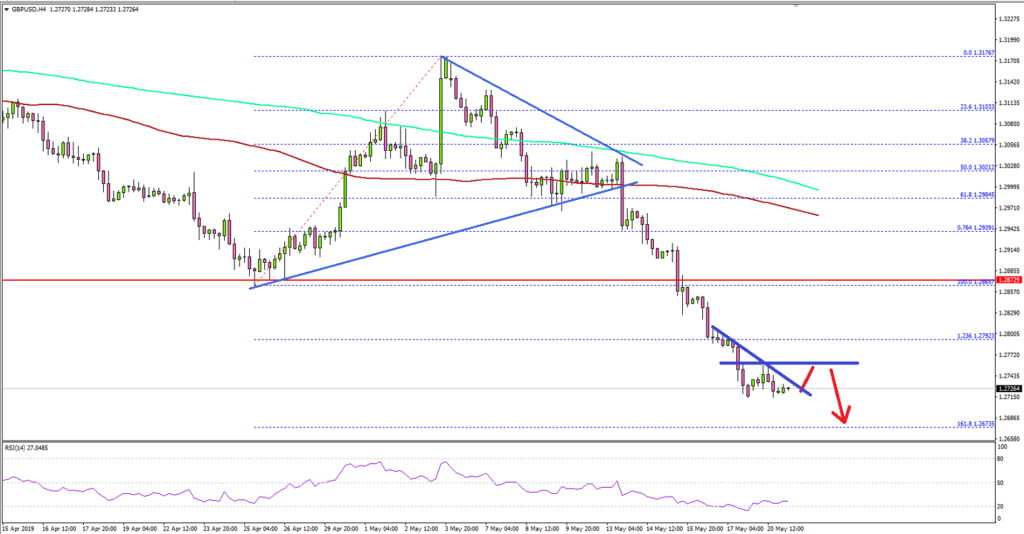
Looking at the 4-hours chart, the pair topped near the 1.3055 level and started a strong decline below the 100 simple moving average (4-hours, red). The decline was initiated after the pair traded below a crucial triangle support at 1.2995.
It opened the doors for a sharp decline below the key 1.2870 support level. The pair even settled below 1.2800 and the 1.236 Fib extension level of the upward move from the 1.2865 low to 1.3176 high.
The next stop for GBP/USD could be the 1.2650 support or the 1.618 Fib extension level of the upward move from the 1.2865 low to 1.3176 high at 1.2673. If there are more downsides, the pair could test the 1.2600 level.
On the upside, an initial resistance is near the 1.2775 and 1.2800 level. However, the main resistance is near 1.2870 (the previous support area). As long as the pair is below 1.2800 and 1.2870, GBP/USD remains in a downtrend and it could continue to decline in the near term.
Fundamentally, the Chicago Fed National Activity Index for April 2019 was released by Federal Reserve Bank of Chicago. The market was looking for a decline in the index from -0.15 to -0.33.
The actual result was disappointing, as there was a sharp decline in the Chicago Fed National Activity Index to -0.45. On the positive side, the past reading was revised up from -0.15 to 0.05.
The report added:
Three of the four broad categories of indicators that make up the index decreased from March, and two of the four categories made negative contributions to the index in April.
Overall, GBP/USD is clearly in a strong downtrend and the current technical indicators suggest more downside towards 1.2650 in the coming sessions. Similarly, there could be more downsides in EUR/USD towards 1.1100.
Economic Releases to Watch Today
- UK’s Inflation Report Hearings.
- US Existing Home Sales Change April 2019 (MoM) – Forecast +2.6%, versus -4.9% previous.


