
Key Highlights
- The Euro climbed above the 0.8700 and 0.8750 resistance levels against the British Pound.
- EUR/GBP surpassed a major bearish trend line with resistance near 0.8640 on the daily chart.
- The UK CPI increased 2.1% in April 2019 (YoY), less than the 2.2% forecast.
- The Euro Zone Manufacturing PMI in May 2019 (Prelim) could rise from 47.9 to 48.1.
EURGBP Technical Analysis
Earlier this month, EUR/GBP retested the key 0.8480 support area and later started a strong upward move. The Euro broke many hurdles and moved into a positive zone above 0.8750 against the British Pound.
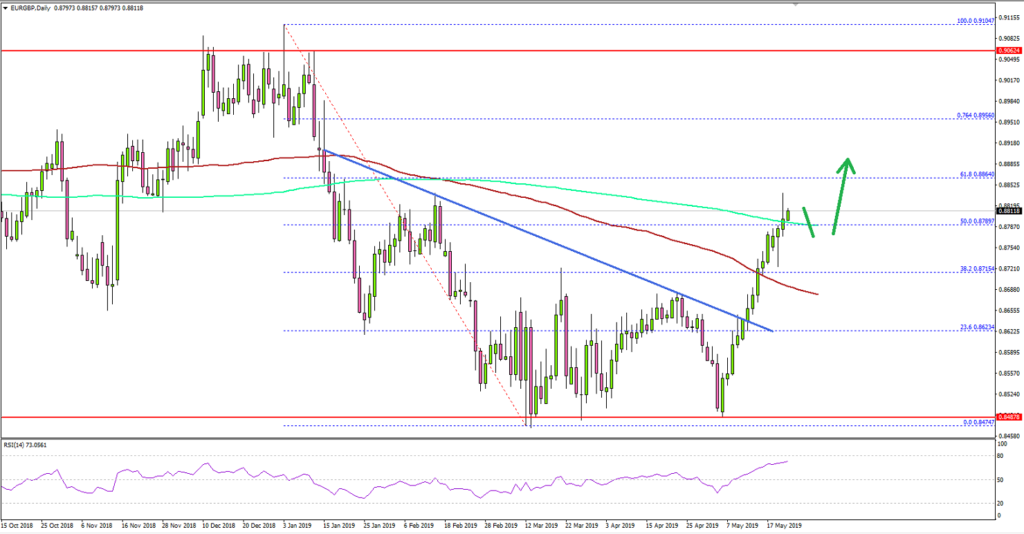
Looking at the daily chart, the pair formed more than twelve green candles from the 0.8489 swing low. During the rise, the pair broke many important resistances near 0.8600 and the 100-day simple moving average (red).
Moreover, the pair traded above a major bearish trend line with resistance near 0.8640 on the same chart. Finally, there was a break above the 50% Fib retracement level of the major drop from the 0.9104 high to 0.8474 low.
The pair is now trading above 0.8800 and the 200-day simple moving average (green). If the pair continues to move higher in the medium term, it could test the 0.8950 level (the 76.4% Fib level). Any further gains could lead the pair towards the 0.9000 resistance area.
Conversely, if EUR/GBP starts a downside correction, it could find support near 0.8750. However, the main support is near 0.8680 and the 100-day simple moving average (red).
Fundamentally, the UK Consumer Price Index for April 2019 was released by the National Statistics. The market was looking for a 2.2% rise in the CPI compared with the same month a year ago.
The actual result lower than the forecast, as the CPI increased 2.1%, but it was better than the last 1.9%. Looking at the monthly change, there was a 0.6% rise in the CPI, less than the 0.7% forecast.
The report added:
The Consumer Prices Index including owner occupiers’ housing costs (CPIH) 12-month inflation rate was 2.0% in April 2019, up from 1.8% in March 2019. Rising energy prices and air fares, which were influenced by the timing of Easter, produced the largest upward contributions to change in the rate between March and April 2019.
Overall, EUR/GBP is showing a lot of bullish signs on the daily chart and it could continue to grind higher in the medium term towards 0.8900, 0.8950 or even 0.9000, considering the recent downward pressure on GBP/USD.
Economic Releases to Watch Today
- German GDP for Q1 2019 (YoY) – Forecast 0.6%, versus 0.6% previous.
- Germany’s Manufacturing PMI for May 2019 (Preliminary) – Forecast 44.8, versus 44.4 previous.
- Germany’s Services PMI for May 2019 (Preliminary) – Forecast 55.5, versus 55.7 previous.
- Euro Zone Manufacturing PMI May 2019 (Preliminary) – Forecast 48.1, versus 47.9 previous.
- Euro Zone Services PMI for May 2019 (Preliminary) – Forecast 53.0, versus 52.8 previous.
- US Manufacturing PMI for May 2019 (Preliminary) – Forecast 52.5, versus 52.6 previous.
- US Services PMI for May 2019 (Preliminary) – Forecast 53.2, versus 53.0 previous.
- US Initial Jobless Claims – Forecast 215K, versus 212K previous.
- US New Home Sales for April 2019 (MoM) – Forecast -2.8% versus +4.5% previous.


