Near term US 10 year note yield outlook:
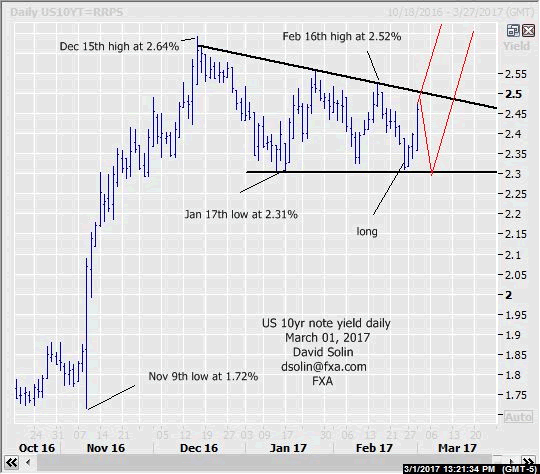
The market has indeed continued to chop in that 2.31/64% range that has been in place since Dec 15th, still seen as a large correction (potential triangle/pennant, continuation pattern) and with eventual new highs after (see in red on daily chart below). Note that the sloppy/messy trade since Dec adds to the view of a triangle (characteristic), while the resolution higher may be rapid (triangles often resolve sharply). On a near term basis, there remains some risk for a further period of ranging before resolving higher (see in red on daily chart below). Nearby resistance is seen at the bearish trendline from Dec/ceiling of the triangle (currently at 2.50/52%) and that Dec 2.64% high. Support is seen at the 2.29/31% with a break/close a bearish sign and aborting this bullish view. Bottom line: rangy trade from the Dec high at 2.64% seen as a correction (poss triangle), suggests eventual upside resolution (potentially sharp).
Strategy/position:
Reached the buy target from the Feb 22nd email at 2.34% (.02 above the base of the triangle) on Feb 24th and for now, would continue to stop on a close below 2.28%. However will want to get more aggressive on an upside resolution of the triangle to maintain a good risk/reward in the position.
Long term outlook:
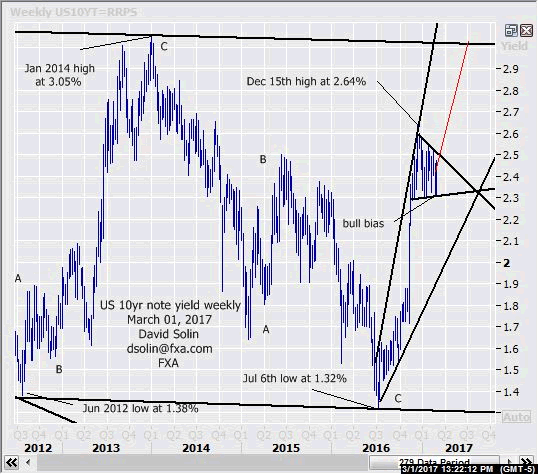
Very long term, the market continues to chop near the middle of the 1.32/3.05% range that has been in place since June 2012 and as been discussing, the 3 wave decline from the Jan 2014 high at 3.05% to the July 6th low at 1.32% (A-B-C) argues a large "complex" correction. Note that the increasing likelihood of another upleg above 2.64% (see shorter term above) argues a huge "flat" type correction and ideally with eventual gains back to that 3.05% high (and even temporarily above). For those familiar with Elliott Wave analyses, "flats" break down to a series of 3-3-5 waves and explains and fits that 3 wave decline to new lows at 1.32% on July 2016. As noted above, a break/close clearly below 2.28/31% would abort the view of this triangle and in turn put this longer term bullish view also on hold. Bottom line : more bullish scenario discussed over the last few months (gains to Jan 2014 high at 3.05%) has become more likely as the action from Dec is seen as a large correction (triangle/pennant).
Strategy/position:
Also switched the longer term bias to bullish on Feb 24th at 2.34% and would continue to use the same exit as the shorter term above (down resolution of the triangle since Dec).
Current:
Nearer term : reached target from Jan 22nd email at 2.34% on Feb 24th. .
Last : short Feb 2nd at 2.47%, took small profit Feb 22nd at 2.42%s (.05 profit).
Longer term: bullish bias Feb 24th at 2.34% for a potentially rapid move to 3.05%.
Last : bear bias Nov 23rd at 2.54% to neutral Jan 13th at 2.40%.