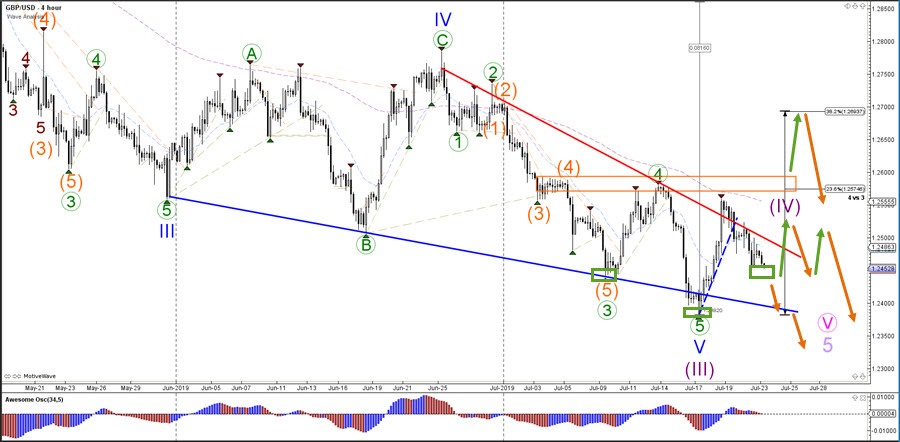
The GBP/USD made a bearish bounce again at the resistance zone (orange box) and 23.6% Fibonacci retracement level of wave 4 vs 3. A bullish bounce could confirm a potential inverted head and shoulders reversal chart pattern (green box) and either indicate a potential triangle chart pattern within the wave 4 or a larger bullish zigzag pattern up to the 38.2% Fibonacci level. Unless price breaks above the 38.2% Fib, the GBP/USD seems ready for a downtrend continuation after a lengthy correction although Brexit news and the announcement of the next UK prime minister could create volatility.
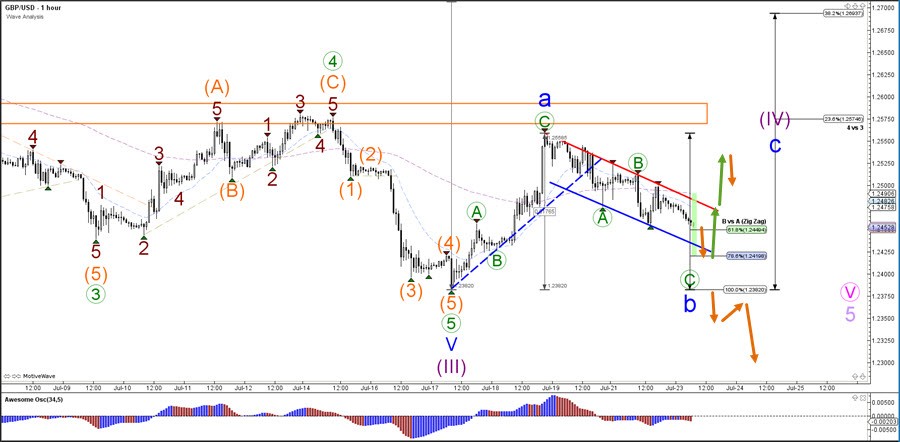
GBP/USD seems to be building a corrective wave B (blue) after a strong bullish up in wave A (blue). For the moment, a bullish bounce at the Fibonacci levels of wave B vs A seems the most likely path of least resistance. This remains valid unless price manages to break below the bottom and 100% Fib level at around 1.2382.