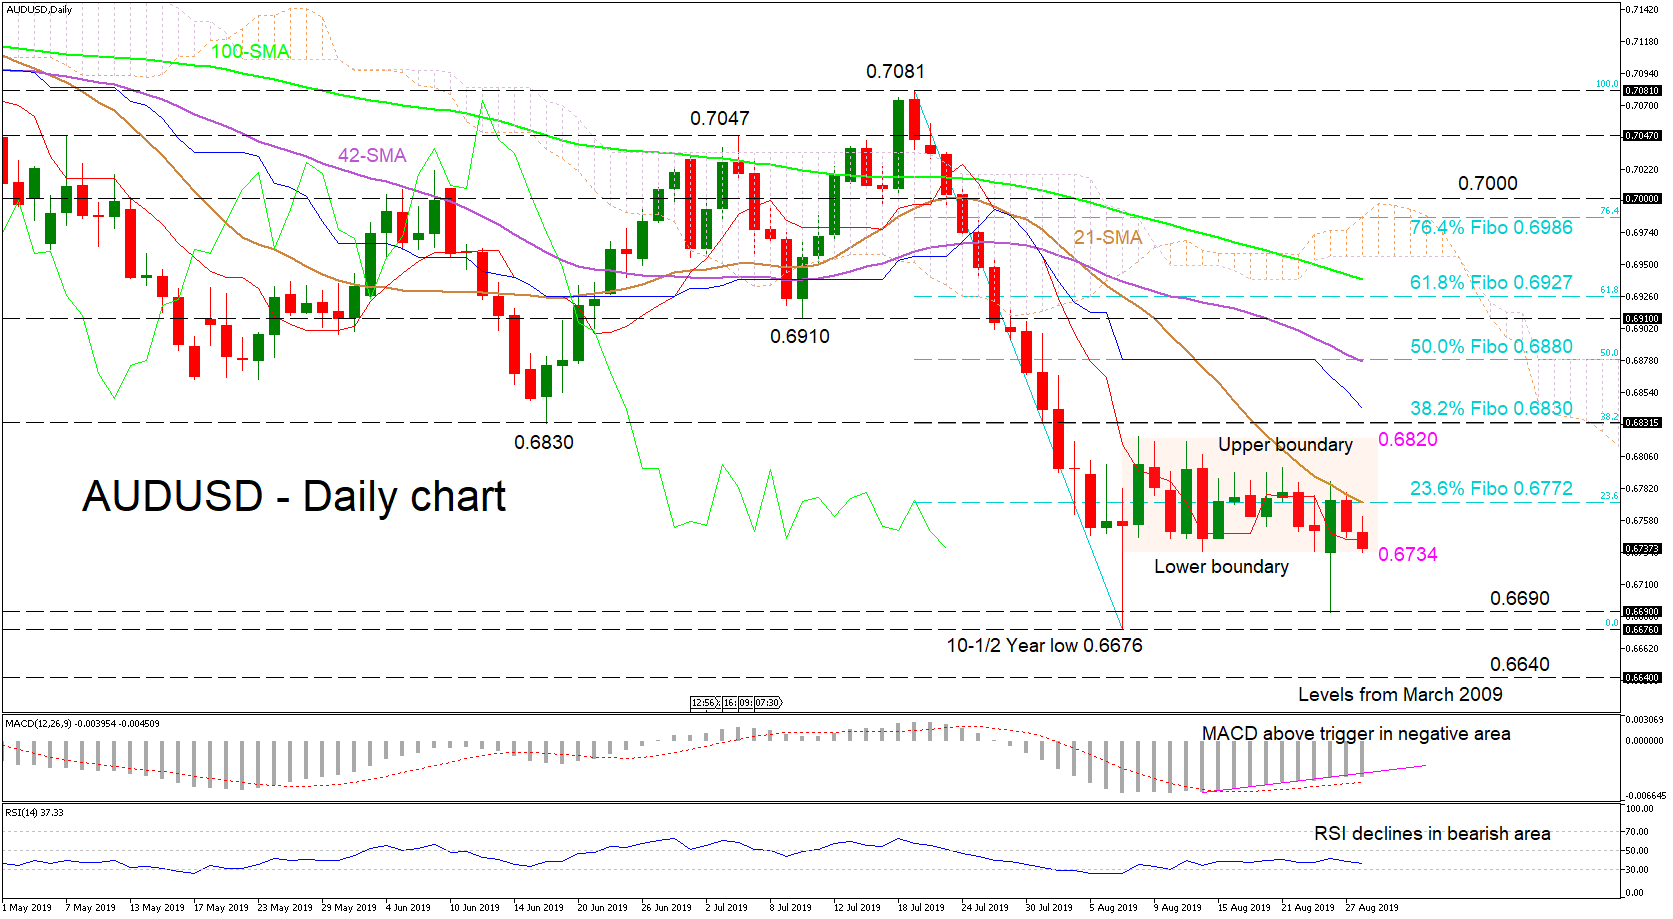
AUDUSD has endured a 20-day trading range with upper boundary of 0.6820 and a lower boundary of 0.6734. The bears seem to be in control, keeping the price closer to the lower boundary, but have yet to close below it. It is worth mentioning that the Tenkan-sen has declined, distancing itself from the Kijun-sen, tilting more to a revival of the down move.
The momentum indicators are also implying that the negative directional momentum could pick up, bringing a new drop. The MACD is in the negative zone, starting to decline to test its trigger, while the RSI is falling lower, presently in bearish territory. Furthermore, the medium-term bearish outlook persists, something also reflected by the 21-, 42- and 100-day simple moving averages (SMAs).
Should the bears penetrate below the lower boundary of 0.6734, the attention would turn to the 10½-year low of 0.6676 once the 0.6690 support is breached. Fracturing the 10½-year trough could see support then come from the 0.6640 level from March 2009.
To the upside, if the price is pushed above 0.6772, which is the 23.6% Fibonacci of the down leg from 0.7081 to 0.6676, coupled with the 21-day SMA, the 0.6820 boundary could be tested. A climb above the 0.6820-0.6830 resistances may bring the pair to a more durable resistance of 0.6880, which is the 50.0% Fibo and where the 42-day SMA lies. Moving even higher, the inside swing barrier of 0.6910 could open the door above to the 100-day SMA and the 0.7000 handle.
Summarizing, the short-term remains in a trading range, and a break above 68.20 or below 0.6734 would reveal the direction.