HomeContributorsTechnical AnalysisElliott Wave View: SP 500 (SPX) New All-Time High Imminent

Elliott Wave View: SP 500 (SPX) New All-Time High Imminent

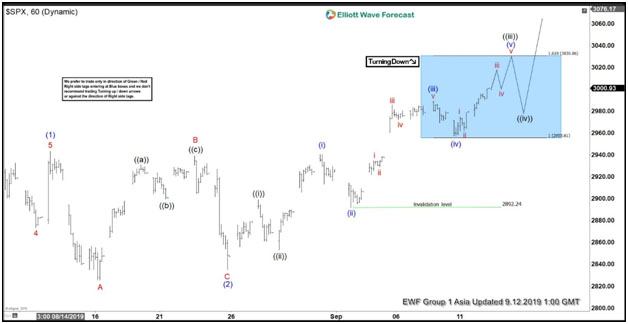
Short term Elliott Wave view suggests the rally in S&P 500 (SPX) from August 6, 2019 low is unfolding as an impulse Elliott Wave structure. In the chart below, we can see wave (1) ended at 2943.31 and wave (2) pullback ended at 2834.97. Internal subdivision of wave (2) unfolded as a running Flat. Wave A ended at 2825.51, wave B ended at 2939.08 and wave C of (2) ended at 2834.97. Wave (3) is currently in progress and expected to eventually make a new all-time high.

Up from 2834.97, wave ((i)) ended at 2898.79 and wave ((ii)) ended at 2853.05. Wave ((iii)) remains in progress and it is unfolding as an impulse Elliott Wave structure in lesser degree. Expect wave ((iii)) to end soon and Index should then pullback in wave ((iv)) before 1 more push higher to end wave ((v)) of 1. We don’t like selling the Index and continue to see near-term support in any dips in 3, 7 ,or 11 swing for further upside.

SP 500 (SPX) 1 Hour Elliott Wave Chart

Elliott Wave Forecast
Elliott Wave Forecasthttps://elliottwave-forecast.com
ElliottWave-Forecast has built its reputation on accurate technical analysis and a winning attitude. By successfully incorporating the Elliott Wave Theory with Market Correlation, Cycles, Proprietary Pivot System, we provide precise forecasts with up-to-date analysis for 52 instruments including Forex majors & crosses, Commodities and a number of Equity Indices from around the World. Our clients also have immediate access to our proprietary Actionable Trade Setups, Market Overview, 1 Hour, 4 Hour, Daily & Weekly Wave Counts. Weekend Webinar, Live Screen Sharing Sessions, Daily Technical Videos, Elliott Wave Setup videos, Educational Resources, and 24 Hour chat room where they are provided live updates and given answers to their questions.

Featured Analysis

Learn Forex Trading