HomeContributorsTechnical AnalysisElliott Wave View: Nike Continues To Make All Time High

Elliott Wave View: Nike Continues To Make All Time High

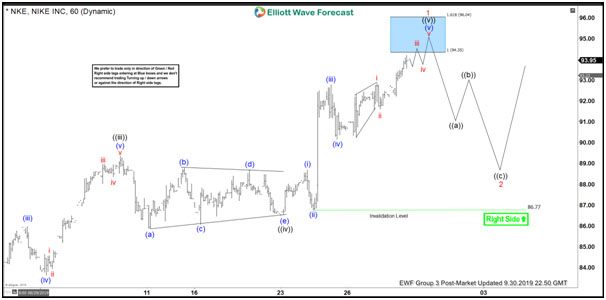
Short term Elliott Wave view on Nike (ticker: NKE) is calling the rally from August 5, 2019 low (78.19) as a 5 waves impulse Elliott Wave structure. The chart below shows wave ((iii)) of the impulse ended at 89.35, and wave ((iv)) pullback ended at 86.54 as a symmetrical triangle. The stock then extended higher in wave ((v)) with internal as an impulse of lesser degree. The entire 5 waves rally is expected to complete at 94.35 – 96.04 and this should also end wave 1 in higher degree.

The stock should then pullback in wave 2 to correct the entire rally from August 5 low before it resumes higher. Wave 2 pullback should unfold in 3, 7, or 11 swing with the key level on August 5 low (78.19). As far as pivot at 78.19 low stays intact during wave 2 pullback, we favor the stock to extend higher. We do not like selling the stock. Potential target to the upside is 100% Fibonacci extension area from Dec 20, 2018 low which comes at 100.4 – 105.9.

NKE 1 Hour Elliott Wave Chart

Elliott Wave Forecast
Elliott Wave Forecasthttps://elliottwave-forecast.com
ElliottWave-Forecast has built its reputation on accurate technical analysis and a winning attitude. By successfully incorporating the Elliott Wave Theory with Market Correlation, Cycles, Proprietary Pivot System, we provide precise forecasts with up-to-date analysis for 52 instruments including Forex majors & crosses, Commodities and a number of Equity Indices from around the World. Our clients also have immediate access to our proprietary Actionable Trade Setups, Market Overview, 1 Hour, 4 Hour, Daily & Weekly Wave Counts. Weekend Webinar, Live Screen Sharing Sessions, Daily Technical Videos, Elliott Wave Setup videos, Educational Resources, and 24 Hour chat room where they are provided live updates and given answers to their questions.

Featured Analysis

Learn Forex Trading