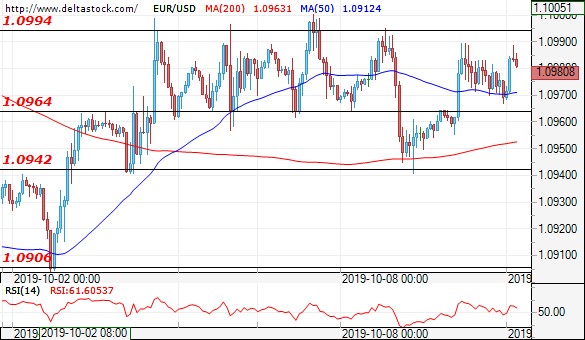
EUR/USD
Current level – 1.0980
TTodays trading sessions should be rather volatile as trade negotiations between the US and China kick off. In the light of conflicting news about the trade war, the currency pair returned in the range 1.0964-1.0994 with the main resistance zone being the upper limit of the range. A successful breakthrough here should push the EUR/USD towards a new test of the next resistance at 1.1025. However, if the support at 1.0942 is violated, the pair should head towards the main support in the 1.0906 zone.
| Resistance | Support | ||
| intraday | intraweek | intraday | intraweek |
| 1.1000 | 1.1176 | 1.0964 | 1.0880 |
| 1.1070 | 1.1176 | 1.0940 | 1.0830 |
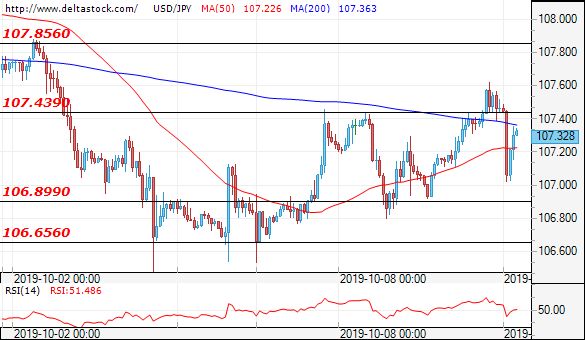
 USD/JPY
Current level – 107.32
After yet another unsuccessful test of the resistance 107.439 the currency pair is gaining momentum a new one. A breakthrough should lead the currency pair towards the next resistance at around 107.85. If market sentiment deteriorates due to trade talks between the US and China breaking down, a move towards 106.65 and an increase in downside momentum is highly probable.
| Resistance | Support | ||
| intraday | intraweek | intraday | intraweek |
| 107.43 | 108.20 | 107.00 | 106.40 |
| 107.88 | 108.80 | 106.68 | 105.80 |
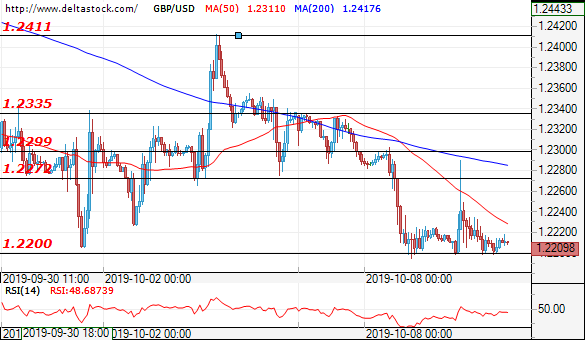
GBP/USD
Current level – 1.2209
As hopes for an orderly Brexit fade due to the rising tensions between the leaders of the European Union and Britain’s Prime Minister Boris Johnson, GBP volatility continues to increase as well. The few successive tests of the main support level at 1.2200 were not successful and the currency pair managed to stay above this level. However, another attempt at breaking this rather important level is likely and, if successful, the GBP/USD should head towards 1.2180 and below. In a positive direction, the first major resistance zone is at 1.2280, followed by 1.2300 and 1.2335 as investors focus on UK’s economic data due 09:30 UK time.
| Resistance | Support | ||
| intraday | intraweek | intraday | intraweek |
| 1.2270 | 1.2400 | 1.2200 | 1.2100 |
| 1.2335 | 1.2550 | 1.2170 | 1.2000 |