
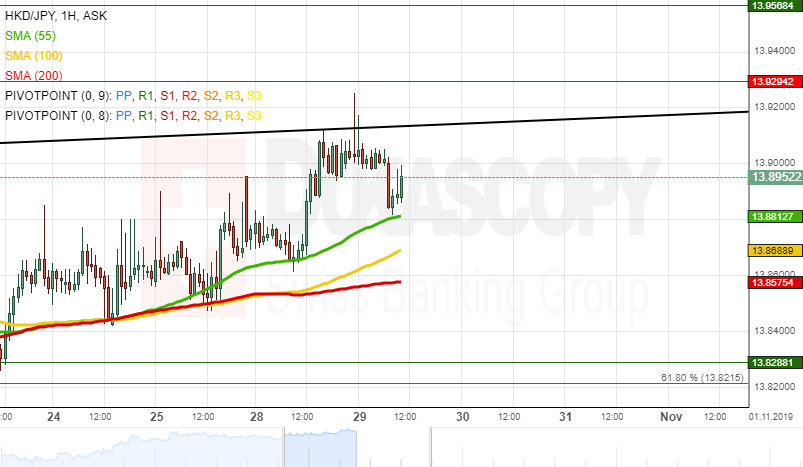
The Hong Kong Dollar has been appreciating against the Japanese Yen since the beginning of September. This movement has been bounded in the rising wedge pattern.
As apparent on the chart, the HKD/JPY exchange rate has been trying to breach the given pattern north since the middle of October. Given that the rate is supported by the 55-, 100– and 200-hour SMAs, it is likely that a breakout north could occur in the nearest future. However, note that the rate has to surpass the resistance level—the Fibonacci 50.00% retracement at 13.97.
If the given resistance level holds, it is likely that a reversal south could occur, and the currency pair could trade downwards in the short term/ In this case, the pair could gain support of the monthly S1 at the 13.56 mark


