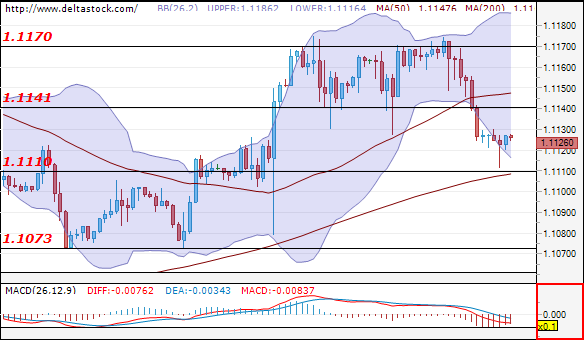
EUR/USD
Current level – 1.1123
After yet another unsuccessful test of the resistance at 1.1170, the euro lost some ground against the Greenback and broke through the minor support at 1.1141, before reaching the major one at 1.1110. As of the current moment, the EUR/USD seems to be consolidating in the narrow range between 1.1120-30, above the aforementioned support. An increase in downward momentum is possible if the ISM non-manufacturing index (15:00 UK time) comes out better than expected. If this proves to be the case and the currency pair breaks through 1.1110, bulls might step in at around 1.1073. Major resistance remains at 1.1170.
| Resistance | Support | ||
| intraday | intraweek | intraday | intraweek |
| 1.1168 | 1.1240 | 1.1139 | 1.1073 |
| 1.1240 | 1.1270 | 1.1100 | 1.0960 |
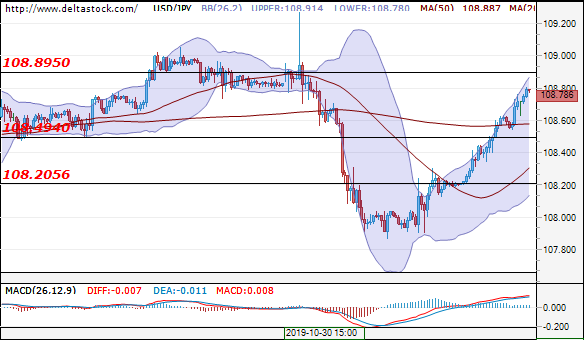
USD/JPY
Current level – 108.78
As markets switched to risk-on mode because of positive developments regarding the US-China trade war, the pair immediately gained some ground and broke through the minor resistance at 107.49. At the moment it looks like the bulls are back in control and a test of the resistance at 108.90 is very likely. In case the Ninja (USD/JPY) manages to break through this resistance, buyers should gain more confidence and push the pair towards the 109.20-30 levels.
| Resistance | Support | ||
| intraday | intraweek | intraday | intraweek |
| 108.90 | 109.20 | 108.50 | 107.85 |
| 108.90 | 109.70 | 107.85 | 107.00 |
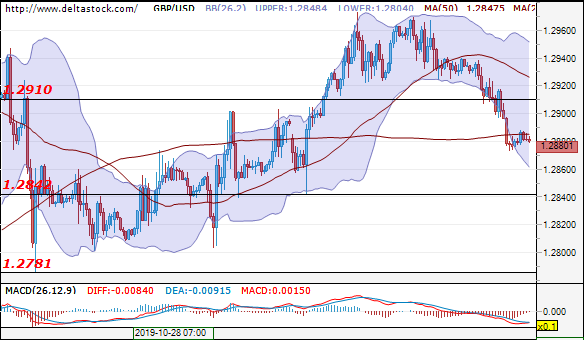
GBP/USD
Current level – 1.2880
The pair is still in its two-week consolidation mode after reaching the 1.30 level. The bottom of the range is at 1.2780-1.2800 and chances for a test of these support levels are high. If broken, the GBP/USD should head towards the next level of support at 1.2700. If bulls step in and stop a potential sell-off at 1.2780-1.2800, the Cable should remain in the aforementioned range for the rest of the day.
| Resistance | Support | ||
| intraday | intraweek | intraday | intraweek |
| 1.2910 | 1.3000 | 1.2840 | 1.2780 |
| 1.2970 | 1.3180 | 1.2840 | 1.2550 |