EUR/USD
The American dollar started the second quarter with a positive tone, edging higher against all of its major rivals this Monday, although holding not far from its recent lows. The EUR/USD pair retreated further after reaching a year high of 1.1445 late last week, settling in the 1.1360 region, in spite of strong EU data released early Europe. The final revision of the EU June Markit manufacturing PMIs showed that the sector’s growth extended into the end of the second quarter, with the index up to 57.4, a fresh six-year high, and above flash estimate of 57.3. Across the region, readings were mixed with the German index up to 59.6, its highest in 74 months according to Markit, while Spain and French figures suffered modest downward revisions. Unemployment in the EU surged to 9.3% in May, above previous 9.25, but below from the 10.2% printed a year earlier. The dollar found support after the US opening in the ISM manufacturing report, as according to it, economic activity expanded for the 97th consecutive month, up to 57.8 in June from previous 54.9.
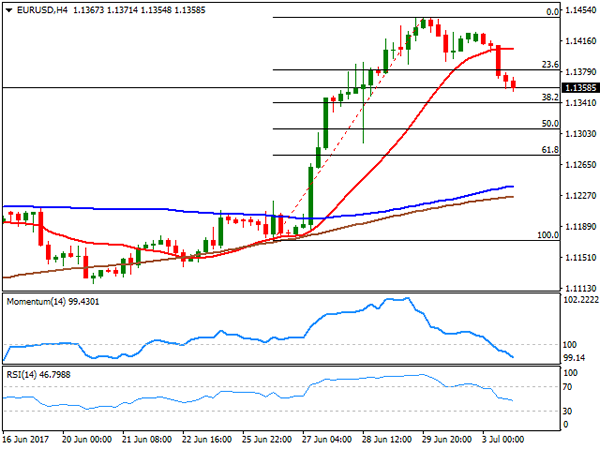
The EUR/USD pair fell down to 1.1355 before paring losses, with selling interest limited after an early US close ahead of the July 4th holiday. From a technical point of view, the pair has broken below the 23.6% retracement of last week’s rally, now the immediate resistance at 1.1380, but more relevant, the pair is retreating after approaching a major long-term resistance, the 1.1460 region, as the pair has been unable to surpass it pretty much since January 2015. Short term, the 4 hours chart shows that the price has also broken below a now horizontal 20 SMA, whilst the Momentum indicator keeps heading south within bearish territory, and the RSI indicator heads south at 46, supporting some further slides ahead. The immediate support comes at 1.1340, the 38.2% retracement of the mentioned rally, followed by Thursday’s low of 1.1290. Below this last, an interim top will be confirmed, anticipating some additional declines for the following sessions.
Support levels: 1.1340 1.1290 1.1250
Resistance levels: 1.1380 1.1420 1.1460
USD/JPY
The American dollar started the second quarter with a positive tone, edging higher against all of its major rivals this Monday, although holding not far from its recent lows. The EUR/USD pair retreated further after reaching a year high of 1.1445 late last week, settling in the 1.1360 region, in spite of strong EU data released early Europe. The final revision of the EU June Markit manufacturing PMIs showed that the sector’s growth extended into the end of the second quarter, with the index up to 57.4, a fresh six-year high, and above flash estimate of 57.3. Across the region, readings were mixed with the German index up to 59.6, its highest in 74 months according to Markit, while Spain and French figures suffered modest downward revisions. Unemployment in the EU surged to 9.3% in May, above previous 9.25, but below from the 10.2% printed a year earlier. The dollar found support after the US opening in the ISM manufacturing report, as according to it, economic activity expanded for the 97th consecutive month, up to 57.8 in June from previous 54.9.
The EUR/USD pair fell down to 1.1355 before paring losses, with selling interest limited after an early US close ahead of the July 4th holiday. From a technical point of view, the pair has broken below the 23.6% retracement of last week’s rally, now the immediate resistance at 1.1380, but more relevant, the pair is retreating after approaching a major long-term resistance, the 1.1460 region, as the pair has been unable to surpass it pretty much since January 2015. Short term, the 4 hours chart shows that the price has also broken below a now horizontal 20 SMA, whilst the Momentum indicator keeps heading south within bearish territory, and the RSI indicator heads south at 46, supporting some further slides ahead. The immediate support comes at 1.1340, the 38.2% retracement of the mentioned rally, followed by Thursday’s low of 1.1290. Below this last, an interim top will be confirmed, anticipating some additional declines for the following sessions.
Support levels: 1.1340 1.1290 1.1250
Resistance levels: 1.1380 1.1420 1.1460
GBP/USD
The American dollar started the second quarter with a positive tone, edging higher against all of its major rivals this Monday, although holding not far from its recent lows. The EUR/USD pair retreated further after reaching a year high of 1.1445 late last week, settling in the 1.1360 region, in spite of strong EU data released early Europe. The final revision of the EU June Markit manufacturing PMIs showed that the sector’s growth extended into the end of the second quarter, with the index up to 57.4, a fresh six-year high, and above flash estimate of 57.3. Across the region, readings were mixed with the German index up to 59.6, its highest in 74 months according to Markit, while Spain and French figures suffered modest downward revisions. Unemployment in the EU surged to 9.3% in May, above previous 9.25, but below from the 10.2% printed a year earlier. The dollar found support after the US opening in the ISM manufacturing report, as according to it, economic activity expanded for the 97th consecutive month, up to 57.8 in June from previous 54.9.
The EUR/USD pair fell down to 1.1355 before paring losses, with selling interest limited after an early US close ahead of the July 4th holiday. From a technical point of view, the pair has broken below the 23.6% retracement of last week’s rally, now the immediate resistance at 1.1380, but more relevant, the pair is retreating after approaching a major long-term resistance, the 1.1460 region, as the pair has been unable to surpass it pretty much since January 2015. Short term, the 4 hours chart shows that the price has also broken below a now horizontal 20 SMA, whilst the Momentum indicator keeps heading south within bearish territory, and the RSI indicator heads south at 46, supporting some further slides ahead. The immediate support comes at 1.1340, the 38.2% retracement of the mentioned rally, followed by Thursday’s low of 1.1290. Below this last, an interim top will be confirmed, anticipating some additional declines for the following sessions.
Support levels: 1.1340 1.1290 1.1250
Resistance levels: 1.1380 1.1420 1.1460
GOLD
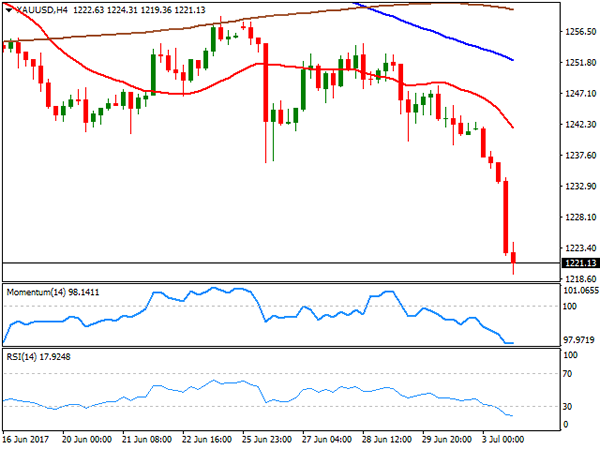
Dollar’s recovery sent gold tumbling this Monday, with spot ending the day around $1,221.00 a troy ounce, its lowest settlement since early May. A recovery in the USD-index after reaching a 9-month low last week alongside with a sharp advance in US Treasury yields undermined the precious metal, while a strong US manufacturing report revived hopes for a soon-to-come rate hike in the US. The technical picture has turned strongly bearish for the commodity, as the daily chart shows that it settled below its 200 DMA for the first time since mid May, whilst a bearish 20 DMA is crossing below the 100 DMA far above the current level. In the same chart, technical indicators head south within negative territory, approaching oversold readings , and also in line with additional slides ahead. In the 4 hours chart, the price is developing below all of its moving averages, with the 20 SMA gaining bearish momentum around 1,241.80, and technical indicators moderating their declines in oversold territory, rather reflecting the low volumes at this time of the day than suggesting downward exhaustion.
Support levels: 1,219.30 1,211.10 1,203.80
Resistance levels: 1,224.40 1,236.50 1,241.80
WTI CRUDE OIL
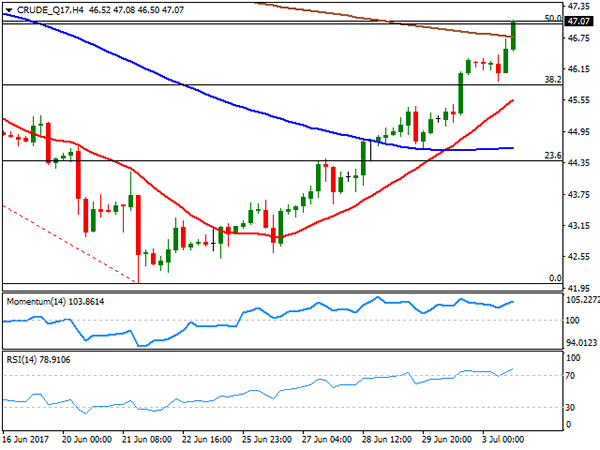
West Texas Intermediate crude oil futures closed the day at $47.05 a barrel, its highest settlement in nearly four weeks, up for an eighth straight session in a row, and despite news indicating that OPEC’s output surged in June to the highest for this year. Most of the increase came from Libya and Nigeria, both countries exempted from the cut deal. News late last week, indicating that US production has decreased keep supporting the commodity that retains the positive tone seen on the previous update, given that in the daily chart, technical indicators continue heading higher within positive territory, whilst the price extended well-above its 20 SMA, now hovering around the 50% retracement of its latest daily decline. In the 4 hours chart, technical indicators accelerated their advances within overbought levels, whilst the price surpassed its 200 SMA for the first time since late May, further supporting additional gains towards 48.15, the 61.8% retracement of the mentioned slide.
Support levels: 46.30 45.80 45.20
Resistance levels: 47.60 48.15 48.80
DJIA
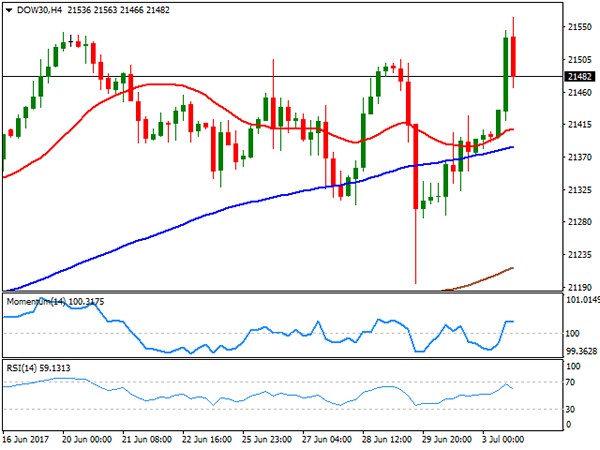
US indexes closed mixed, with the Nasdaq Composite down 30 points, to 6,110.06 amid a decline in tech-related equities, but the Dow Jones Industrial Average settled at 21,479.27, up 129 points and after setting a record high intraday of 21,563. The S&P also closed up at 2,429.01, advancing 0.23%. Gains were led by financials and energy-related equities, and within the Dow, Goldman Sachs was the best performer, up 2.42%, followed by JPMorgan that added 2.04%. Chevron, El du Pont and Exxon Mobil, all added over 1.50%. Microsoft was the worst performer, down 1.10%, followed by Intel that shed 0.83%. Technically, the daily chart for the DJIA shows that the index recovered after hovering around a bullish 20 DMA during the last days of the past week, whilst technical indicators have bounced from their mid-lines, with a limited upward potential ahead of Tuesday’s holiday. In the 4 hours chart, the index settled above all of its moving averages, but given the strong retracement ahead of the close, technical indicators have lost upward strength, with the RSI already turning lower, but both within positive territory, limiting chances of a steeper decline ahead.
Support levels: 21,420 21,361 21,310
Resistance levels: 21,462 21,506 21,563
FTSE100
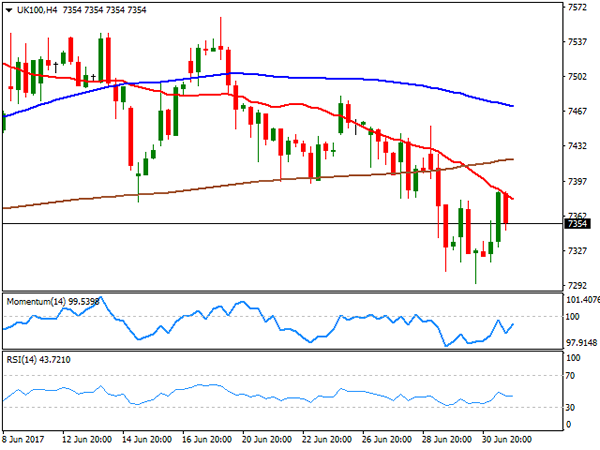
The FTSE 100 closed the day at 7,377.09, up roughly 65 points amid a continued advance in oil prices and a weaker Pound. The Footsie put a halt to a 4-day slide, helped further by a recovery in a mining sector. Glencore led advancers, settling 5.01% higher, followed by Rio Tinto and Anglo American that added 4.0% each. Provident Financial, on the other hand, was the worst performer, closing 2.67% lower, followed by Micro Focus International that lost 1.85%. The daily chart for the London benchmark shows that the index was unable to recover above its 100 DMA, whilst the 20 DMA continues heading south above the largest, and technical indicators have bounced modestly from near oversold levels, but are still within negative territory, all of which suggests that the risk remains towards the downside. In the 4 hours chart, the risk is also towards the downside, given that an early advance was contained by a bearish 20 SMA, currently at 7,380, while technical indicators hover within bearish territory, with no certain directional strength.
Support levels: 7,331 7,294 7,256
Resistance levels: 7,380 7,424 7,452
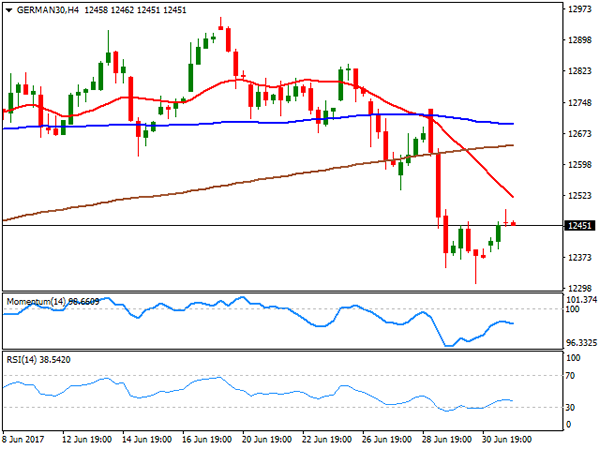
DAX
The German DAX advanced 1.22% or 152 points at the beginning of the week to settle at 12,471.31, with all European index closing with gains as banks and mining-related equities led the way higher. The Markit manufacturing PMI was revised higher in Germany, up to 59.6 from 59.5 in May, the highest in 74 months according to the official report. Commerzbank was the best performer within the DAX, up 4.29%, followed by ThyssenKrupp that added 4.01%. Vonovia topped losers’ list, with a 0.89% decline. The recovery was not enough to revert the negative tone in the benchmark, as in the daily chart, it remains well below a bearish 20 DMA, whilst technical indicators have barely lost downward strength, holding near oversold readings. In the same chart, a light of hope comes from the fact that the price has extended its bounce from its 100 DMA. Shorter term, and according to the 4 hours chart, the upside also seems limited as the intraday advance stalled well-below a still strongly bearish 20 SMA, whilst technical indicators resumed their declines within negative territory, after correcting oversold readings.
Support levels: 12,420 12,364 12,310
Resistance levels: 12,448 12,490 12,542