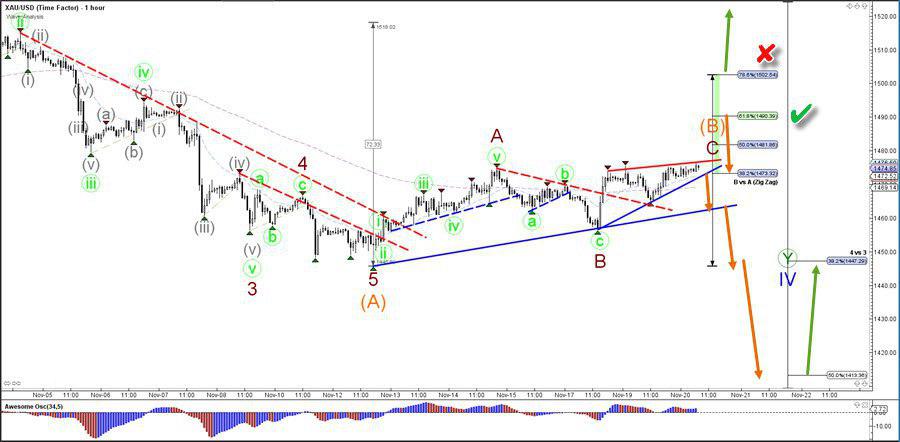
The XAU/USD seems to be building a complex WXY correction (green) within wave 4 (blue) as long as the price stays below the Fibonacci retracement levels of wave B vs A. A break above the resistance trend line (red) indicates that the wave 4 (blue) pattern has already been completed at the 38.2% Fib level of wave 4 vs 3 whereas a break below the support (blue) indicates a bearish continuation towards the 50% Fib of wave 4 vs 3.
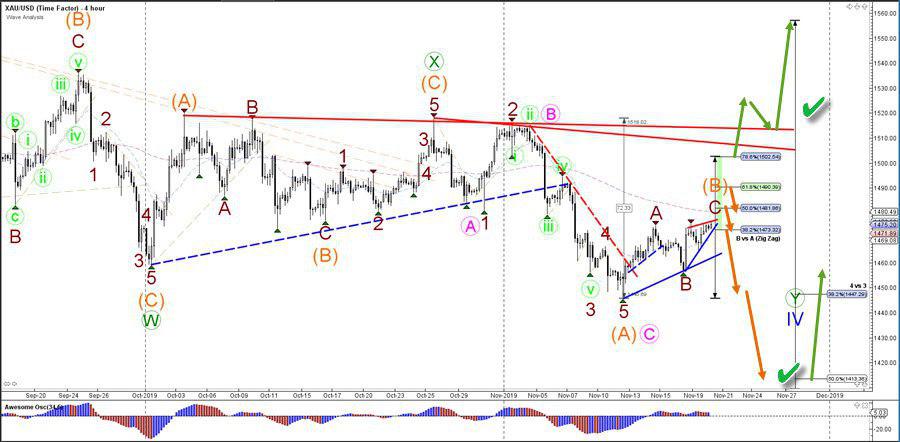
The XAU/USD seems to be completing a bullish ABC (dark red) zigzag correction within a potential wave B (orange). The usual retracement Fib for such a wave B is the 61.8% level (green check). A break above the 78.6% and key $1500 resistance makes the ABC pattern less likely (red x) whereas a break below support (blue) could send the price lower (orange arrow).