
The EUR/USD currency pair
Technical indicators of the currency pair:
Prev Open: 1.10585
Open: 1.10157
% chg. over the last day: -0.01
Day’s range: 1.10228 – 1.10279
52 wk range: 1.0884 – 1.1623
At the end of last week, the EUR/USD currency pair went down. At the moment, the trading instrument is in lateral movement. The local support and resistance levels are 1.10150 and 1.10350, respectively. On Friday, EU published mixed reports. CB Chairman Christine Lagarde noted the general uncertainty in the global economy and encouraged Europe to develop a new set of measures, including budgetary incentives. The US dollar strengthened after comments by US President Trump that the trade deal with China is “very close.” We recommend opening positions from key levels.
Germany published the IFO business climate index at 11:00 (GMT+2:00).
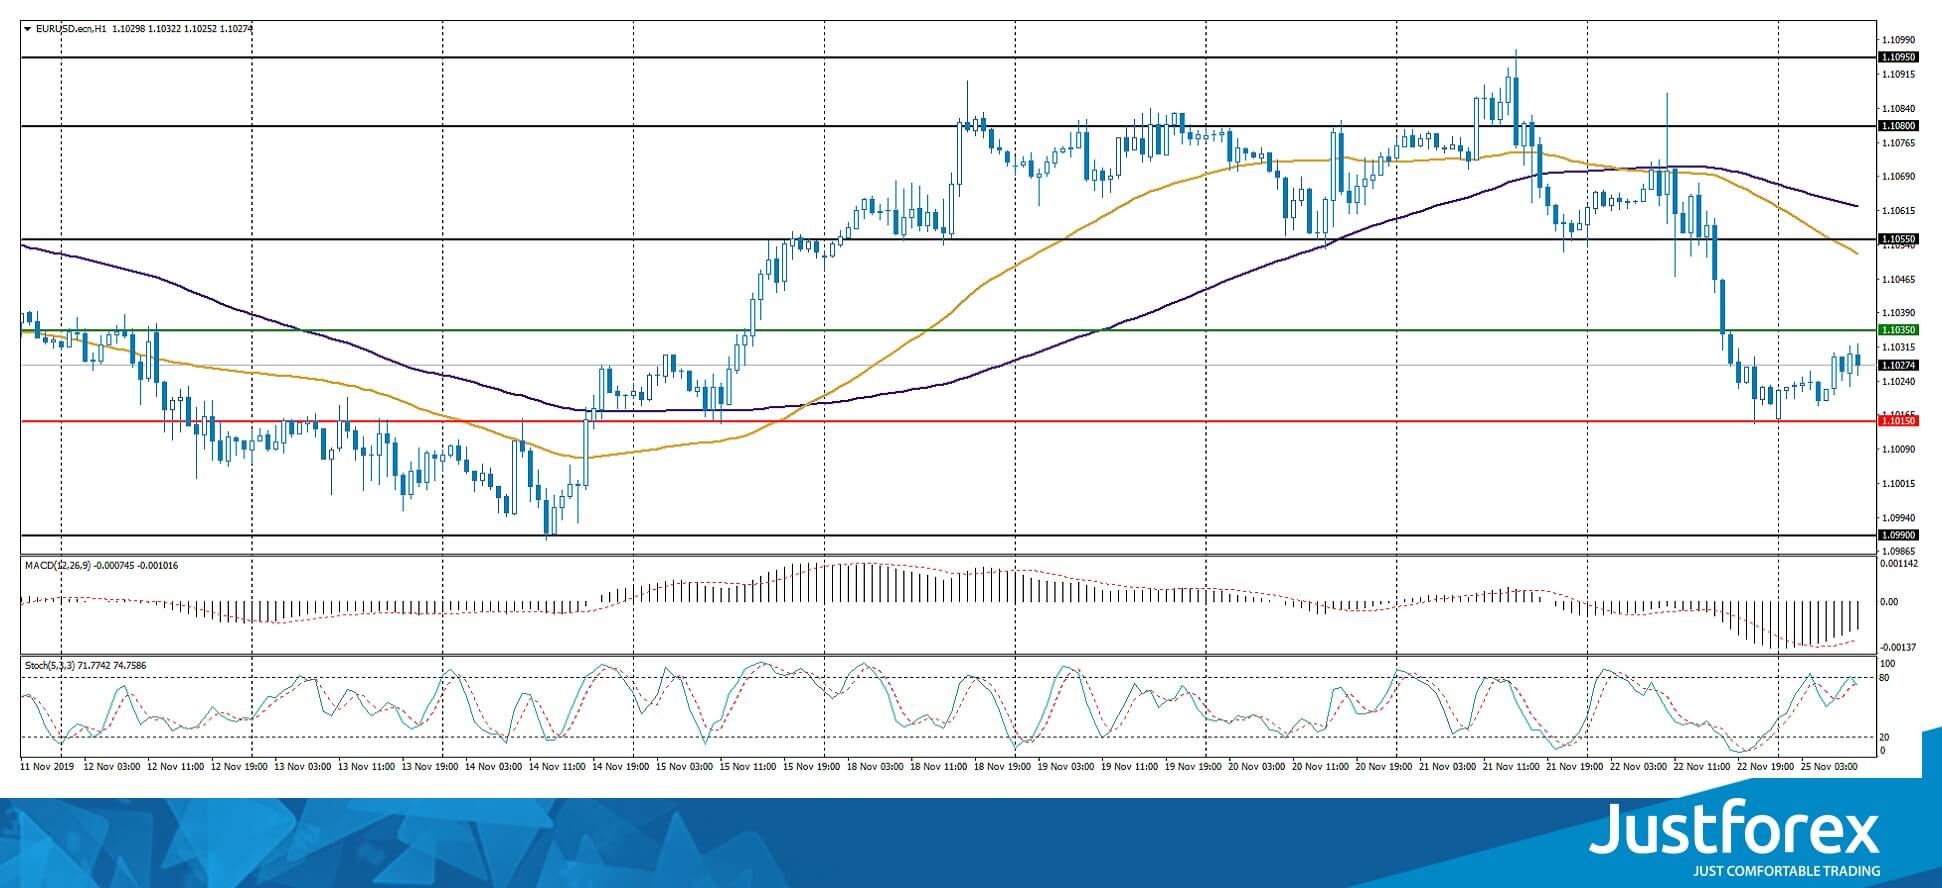
The price fixed below 50 MA and 100 MA, which signals the strength of sellers.
The MACD histogram is in the negative zone but above the signal line, which gives a weak signal to sell EUR/USD.
The Stochastic Oscillator is in the neutral zone, the %K line crosses the %D line. There are no signals at the moment.
Trading recommendations
Support levels: 1.10150, 1.09900
Resistance levels: 1.10350, 1.10550, 1.10800
If the price consolidates above 1.10350, expect the quotes to grow toward 1.10550-1.10700.
Alternatively, the quotes could drop toward 1.09900-1.09700.
The GBP/USD currency pair
Technical indicators of the currency pair:
Prev Open: 1.29055
Open: 1.28515
% chg. over the last day: +0.15
Day’s range: 1.28691 – 1.28659
52 wk range: 1.1959 – 1.3385
On Friday, the GBP/USD currency pair dropped down because of weak economic reports from the UK. The business activity index in the manufacturing sector was 48.3 instead of 48.8. The business activity index in the services sector was 48.6 instead of 50.1. Economic performance is deteriorating due to uncertainty around Brexit. At the moment, GBP has recovered a significant part of the losses. The key support and resistance levels are 1.28400 and 1.28750. Open positions from key levels.
The Economic News Feed for 25.11.2019 is calm.
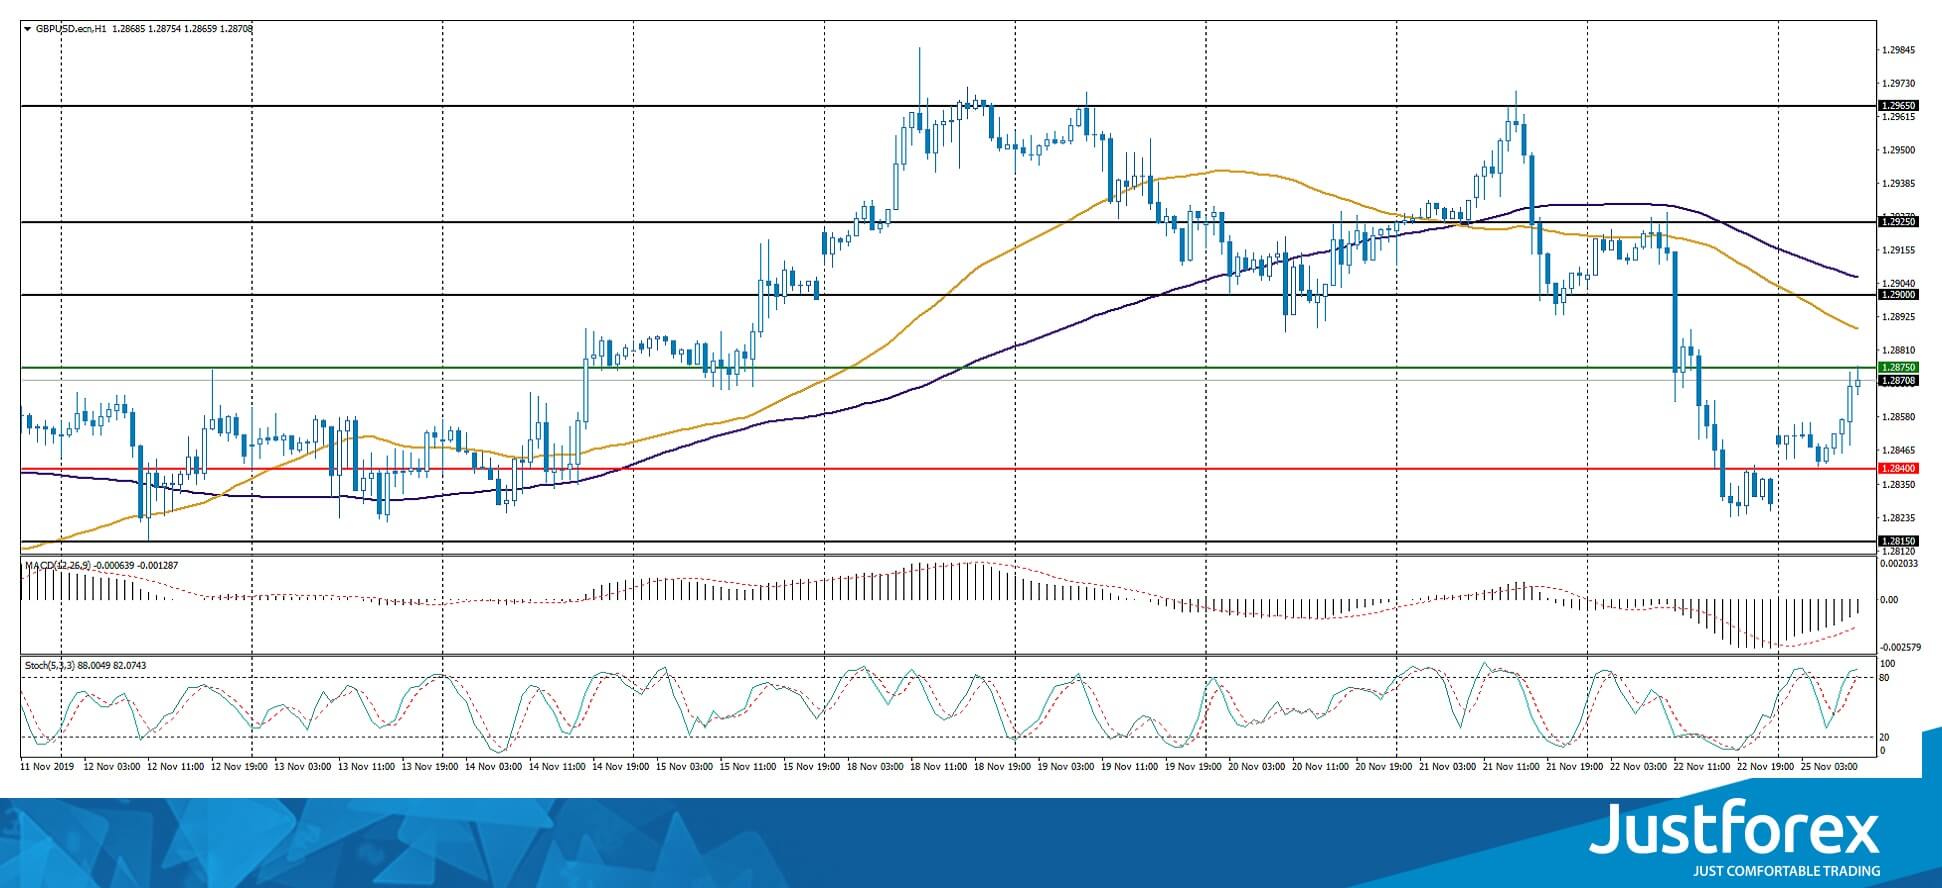
Indicators point to the power of sellers: the price has fixed below 50 MA and 100 MA.
The MACD histogram is in the negative zone but above the signal line, which gives a weak signal to sell GBP/USD.
The Stochastic Oscillator has reached overbought zone, the %K line is above the %D line, which indicates bullish sentiment.
Trading recommendations
Support levels: 1.28400, 1.28150, 1.28000
Resistance levels: 1.28750, 1.29000, 1.29250
If the price consolidates above 1.28750, expect the quotes to rise toward 1.29000-1.29250.
Alternatively, the quotes could descend toward 1.28200-1.28000.
The USD/CAD currency pair
Technical indicators of the currency pair:
Prev Open: 1.32828
Open: 1.32954
% chg. over the last day: -0.17
Day’s range: 1.32698 – 1.32882
52 wk range: 1.2727 – 1.3664
At the moment, USD/CAD quotes are moving sideways. There is no defined trend. The local support and resistance levels are 1.32750 and 1.33000, respectively. On Friday, Canada published a positive retail sales report. However, the USD was also strong, which led to the consolidation. Investors expect additional drivers. We recommend you to pay attention to the dynamics of prices of “black gold”. Open positions from key levels.
The Economic News Feed for 25.11.2019 is calm.
Indicators do not give accurate signals: the price crossed 50 MA and 100 MA.
The MACD histogram has approached the 0 mark.
The Stochastic Oscillator is in the oversold zone, the %K line is below the %D line, which gives a weak signal to sell USD/JPY.
Trading recommendations
Support levels: 1.32750, 1.32550, 1.32300
Resistance levels: 1.33000, 1.33250
If the price consolidates below 1.32750, expect the quotes to descend toward 1.32500-1.34300.
Alternatively, the quotes could grow toward 1.33250-1.33400.
The USD/JPY currency pair
Technical indicators of the currency pair:
Prev Open: 108.625
Open: 108.660
% chg. over the last day: +0.06
Day’s range: 108.838 – 108.896
52 wk range: 104.97 – 114.56
The USD/JPY currency pair has moved up. The trading tool has updated the local highs. Demand for the safe haven currencies weakened amid positive news on the settlement of the trade conflict between Washington and Beijing. At the moment, USD/JPY quotes are consolidating in the range of 108.700-108.900. We recommend you to pay attention to the dynamics of yield on US government bonds and open positions from key levels.
The Economic News Feed for 25.11.2019 is calm.
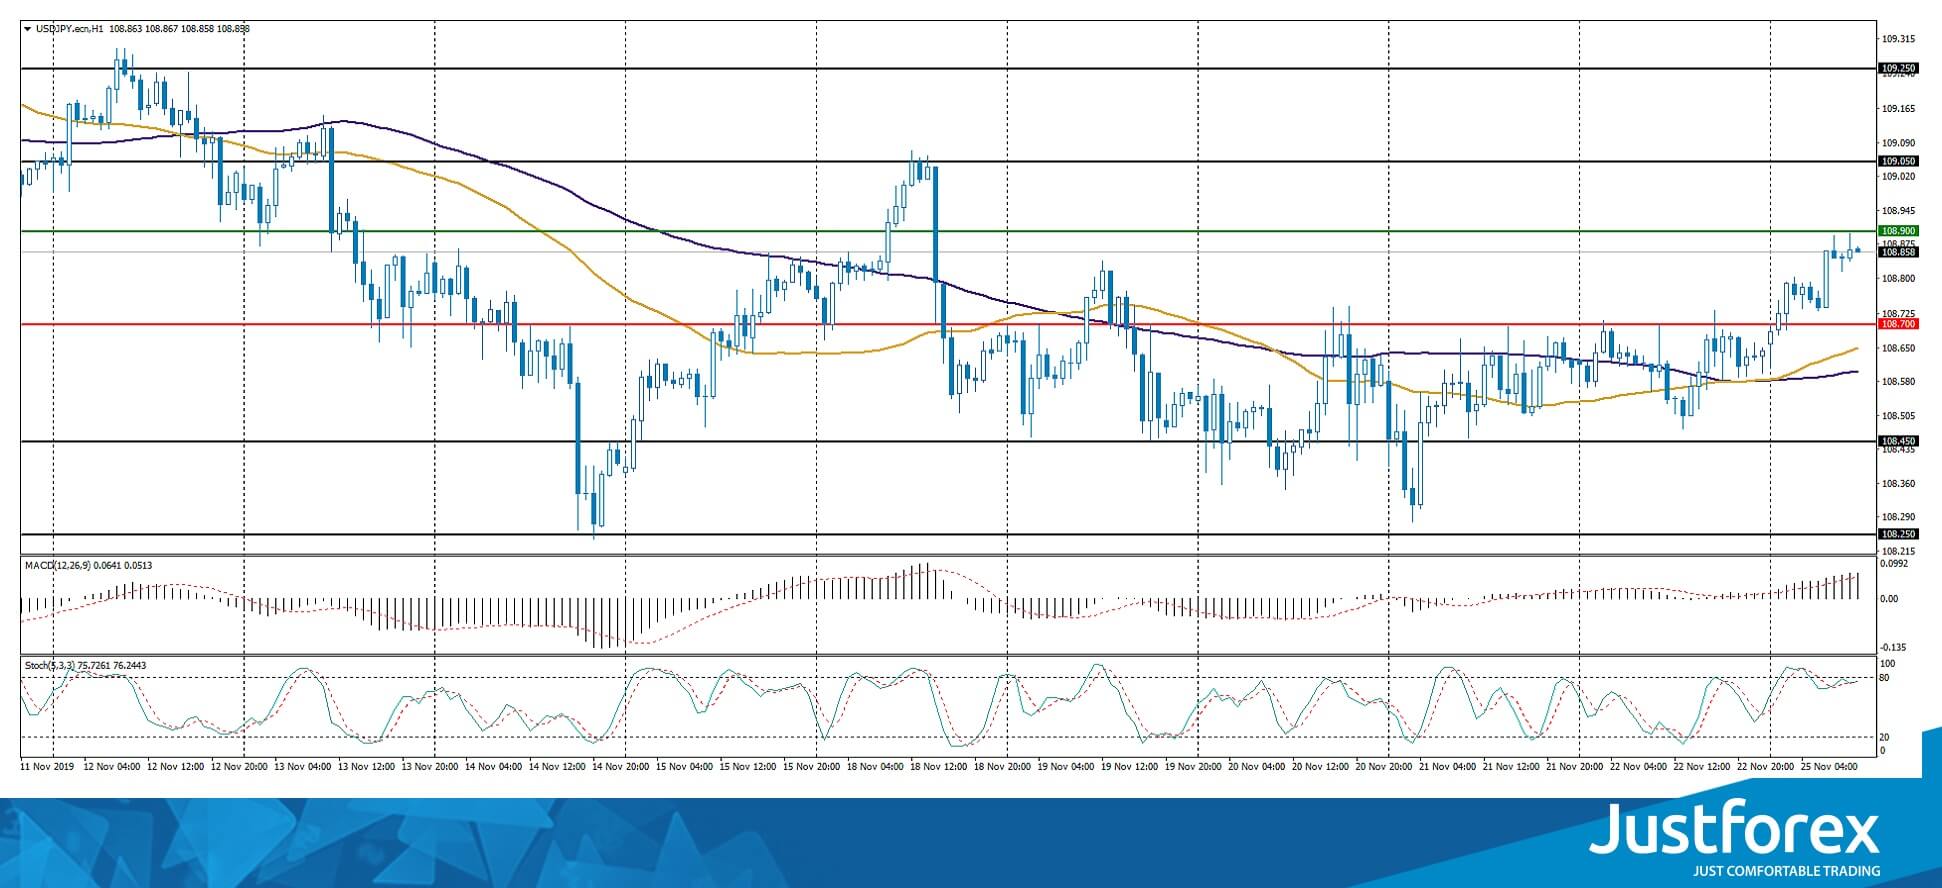
Indicators point to the strength of buyers: the price has fixed above 50 MA and 100 MA.
The MACD histogram is in the positive zone and above the signal line, which gives a strong signal to buy USD/JPY.
The Stochastic Oscillator is near the overbought zone, the %K line crosses the %D line. There are no signals.
Trading recommendations
Support levels: 108.700, 108.450, 108.250
Resistance levels: 108.900, 109.050, 109.250
If the price consolidates above 108.900, expect the quotes to grow toward 109.150-109.250.
Alternatively, the quotes could descend toward 108.550-108.450.


