EUR/USD
The greenback edged higher for a second consecutive day against the common currency, with the pair trading as low as 1.1335 before settling a few pips above it. A holiday in the US forced markets into an early close this Tuesday, with action only limited to the Canadian dollar during the last trading hours of the day. The EUR/USD pair advanced up to 1.1373 early Asia, but pulled back afterwards, helped by poor EU PPI figures, as inflation at factory levels fell by 0.4% in May, doubling expectations of a 0.2% decline and well -below the 0.0% printed in April. On a positive note, the EU commission approved the rescue of Italian Banca Monte dei Paschi di Siena by a 5.4 billion-euro capital injection from the local government. This Wednesday, the EU will see the release of the final Markit services and composites PMIs for June, but attention will center in the upcoming FOMC Minutes in the US afternoon.
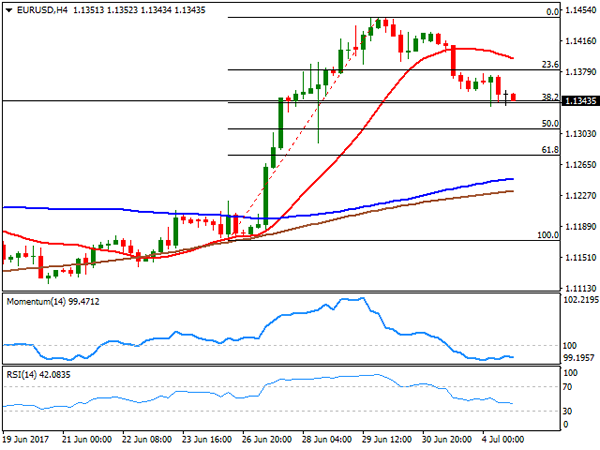
From a technical point of view, the pair is pressuring the 38.2% retracement of last week’s rally at 1.1340, still unable to break below it, but gaining short-term bearish traction as bounces from the level stalled short of the next Fibonacci level, now the immediate resistance at 1.1380. In the 4 hours chart, the 20 SMA turns south above the current level, whilst technical indicators remain within bearish territory, although with limited downward strength amid the absence of volume. The key support anyway, remains to be 1.1290, the low set on June 28th, with a break below it favoring a steeper decline ahead.
Support levels: 1.1340 1.1290 1.1250
Resistance levels: 1.1380 1.1420 1.1460
USD/JPY
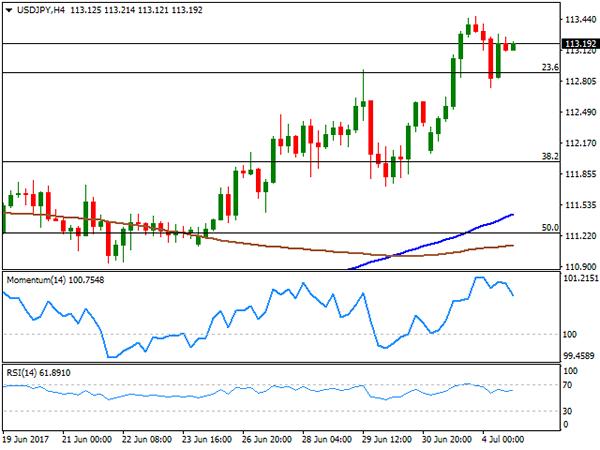
The USD/JPY pair bounced from a daily low of 112.73 reached at the beginning of the day after North Korea said it successfully test fired an intercontinental ballistic missile. The sour sentiment extended into the European session, with most indexes closing in the red. The pair recovered early London as the dollar got once again investor’s favor, but the rally was contained around the current 113.20 level. The June Markit services PMI will be released during the upcoming Asian session, last seen at 53, while in the US, attention will center on the FOMC Minutes, to be released later on Wednesday. Also, backing the recovery in the pair were US Treasury yields, which held at the two-month highs reached on Monday. The short term picture for the pair shows that the upward momentum eased, but also that the risk remains towards the upside, as the 100 SMA extends its advance above the 200 DMA, both well below the current level, while the RSI indicator consolidates around 61. Additionally, the pair recovered after briefly breaking below the 23.6% retracement of its latest decline, the immediate support at 112.90.
Support levels: 112.90 112.50 112.10
Resistance levels: 113.45 113.90 114.40
GBP/USD
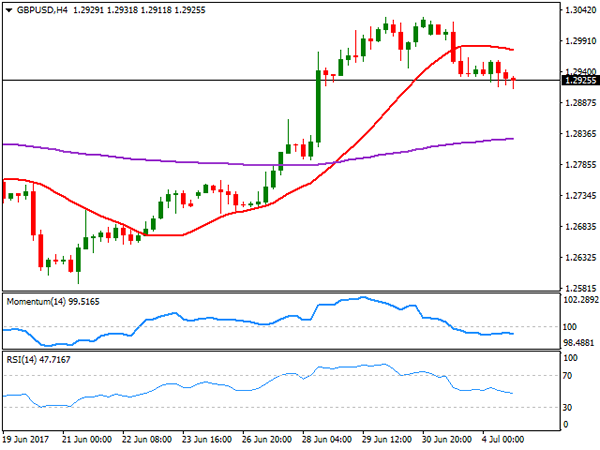
The Pound maintained the sour tone this Tuesday, extending its decline against the greenback down to 1.2911, its lowest since last Wednesday. The Sterling suffered from the release of the Markit Construction PMI, as the index came at 54.8 in June, down from 56.0 in May. The report attributed the slowdown in the construction sector to risk aversion among clients, reflecting concerns about the economic outlook and political uncertainty. The UK services PMI will be released this Wednesday, expected at 53.5 from previous 53.8. Should the release miss expectations, the GBP will be subject of further sells. Technically, the 4 hours chart shows that the pair is biased lower, as its developing below its 20 SMA, currently at 1.2975, whilst technical indicators remain within bearish territory, with the RSI now at 47, anticipating some further slides on a break below 1.2910. A first line of selling interest waits around 1.2960, the immediate short term support, with the downward pressure easing on a recovery beyond it.
Support levels: 1.2910 1.2870 1.2825
Resistance levels: 1.2960 1.2995 1.3040
GOLD
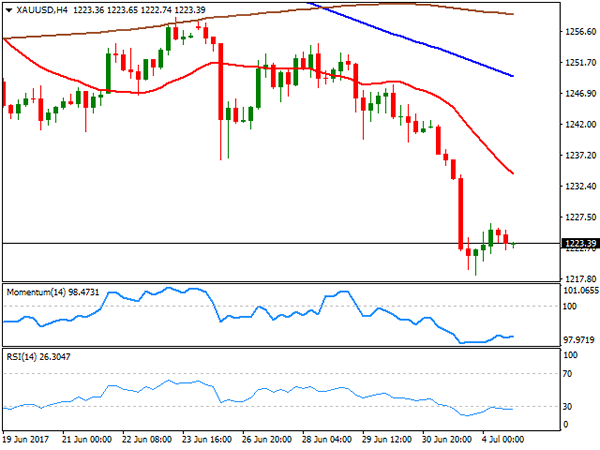
Spot gold saw limited action this Tuesday, ending the day barely up at $1,223.39 a troy ounce, as mounting risk aversion on geopolitical tension in Asia, triggered demand for the safe-haven asset, later reverted by renewed dollar’s demand. The bright metal was confined to a tight range at the lower end of Monday’s range, as investors were cautious ahead of the FOMC Minutes´ release this Wednesday. The US Federal Reserve is not expected to surprise markets, but a hawkish change in the wording could fuel recent dollar’s advance. From a technical point of view, the daily chart shows that the early advance was rejected by selling interest around the 200 DMA, whilst technical indicators lost their bearish strength, but hold near oversold levels, supporting the ongoing downward move. In the 4 hours chart, the price is developing below a strongly bearish 20 SMA, while indicators consolidate within oversold territory, in line with the longer term perspective.
Support levels: 1,219.30 1,211.10 1,203.80
Resistance levels: 1,224.40 1,236.50 1,241.80
WTI CRUDE OIL
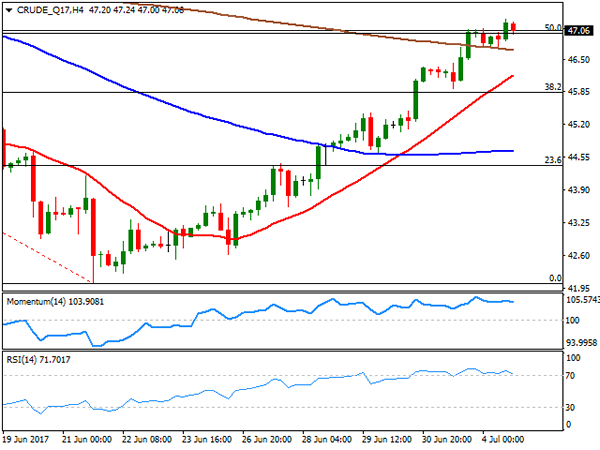
Crude oil prices managed to advance modestly at the beginning of the day, but closed it pretty much unchanged, with WTI futures settling at $47.06 a barrel. The commodity started the day with a soft tone, easing down to 46.73 before bouncing to set a fresh multi-week high of 47.30. Early Asia, the US will release its API crude stockpiles report, although the EIA one, usually more relevant, has been delayed to Thursday amid the 4th of July holiday. The US benchmark closed for a second consecutive day around the 50% retracement of its latest daily decline between 51.98 and 42.04, maintaining the positive tone in the daily chart, as the price remains well below its 20 DMA, whilst technical indicators hold well-above their mid-lines, losing their upward momentum only due to the ongoing holiday. Shorter term, and according to the 4 hours chart, the risk remains towards the upside, as technical indicators consolidate within overbought territory, whilst the price remains above all of its moving averages, with the 20 SMA accelerating its advance after crossing above the 100 SMA.
Support levels: 46.70 46.10 45.50
Resistance levels: 47.30 48.00 48.70
DJIA
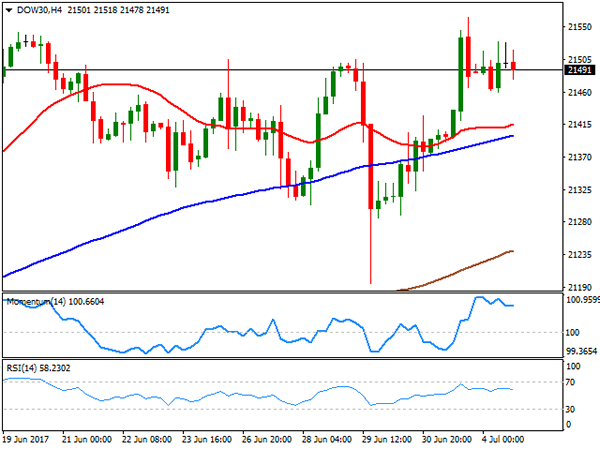
Wall Street remained closed this Tuesday amid the celebration of the 4th of July in the US, with the DJIA latest registered close at 21,479.27. Despite the negative tone of Asian and European equities, the index managed to gain modestly in electronic trading, heading into Wednesday’s opening at 21,491. Risk aversion seen early Tuesday seem to have eased, although Asian shares will determinate whether the index can resume its advance during the upcoming session. From a technical point of view, the daily chart for the index shows that it holds above a bullish 20 DMA, and far above the larger ones, while technical indicators stand within positive territory, but with limited upward strength, maintaining the risk towards the upside. In the 4 hours chart, technical indicators have partially corrected from overbought readings before turning flat well above their mid-lines, whilst the index remains far above its moving averages, also supporting some further gains ahead.
Support levels: 21,462 21,420 21,361
Resistance levels: 21,506 21,563 21,600
FTSE100
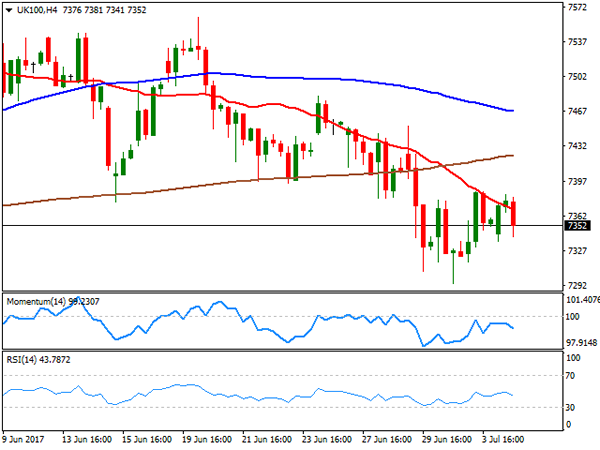
The FTSE 100 extended its slide by 19 points, and closed the day at 7,357.23, with an advance in the mining-sector limiting risk aversion slides. Worldpay Group out-stood, adding 27.70% after the company confirmed it has been approached by U.S. rival Vantiv about a possible takeover. Among the best performers were Randgold Resources that added 2.01%, and Fresnillo that gained 1.16%. Provident Financial led decliners, ending the day 1.98% lower, followed by Smith & Nephew that shed 1.88%. From a technical point of view, the index has made no progress, still at risk of falling further as an intraday advance was once again rejected by selling interest around the 100 DMA, whilst the 20 DMA extended its decline above the largest, and technical indicators hold within bearish territory, turning south. In the shorter term, and according to the 4 hours chart, a bearish 20 SMA limited advances, now at 7,365, whilst technical indicators hover within negative territory, still lacking directional strength.
Support levels: 7,331 7,294 7,256
Resistance levels: 7,380 7,424 7,452
DAX
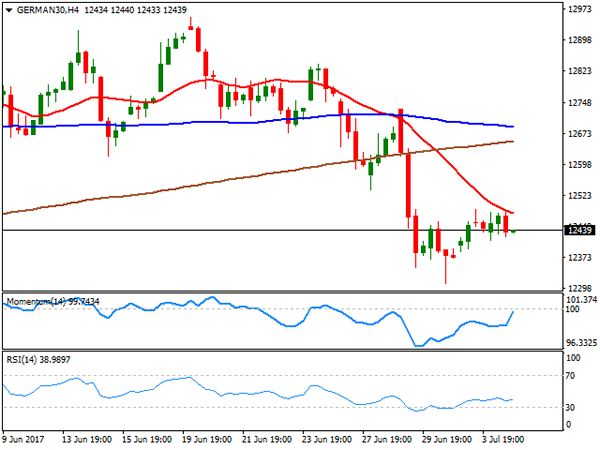
European equities closed lower this Tuesday, led by a decline in tech and industrial equities. The German DAX lost 0.31% or 38 points, to end at 12,437.13, with banks mixed, as Deutsche Bank was the best performer, up 1.64%, while Commerzbank led losers’ list with a 2.07% decline. Sentiment was dented by news that North Korea launched an intercontinental ballistic missile, claiming that it can hit the US state of Alaska. Activity, however, was limited by US markets being closed on holidays. As for the technical outlook, the daily chart shows that the index held above a bullish 100 DMA, but confined within Monday’s range, and with technical indicators flat well-below their mid-lines, limiting chances of a stronger recovery at the time being. In the 4 hours chart, a bearish 20 SMA continues to cap advances, while technical indicators recovered, but remain within negative territory, also limiting the upward potential.
Support levels: 12,420 12,364 12,310
Resistance levels: 12,490 12,536 12,587