EUR/USD
The EUR/USD pair trimmed most of its weekly losses and re-surged above the 1.1400 level, getting an expected boost from the ECB’s account of the monetary policy meeting, as the document showed that policymakers discussed removing the pledge to increase their bond-buying program if needed in their policy communication, but decided to be cautious as the economic recovery has yet to result in higher inflation, and to prevent upsetting financial markets. Further supporting the advance was receding demand for the greenback, after data released this Thursday disappointed, particularly that related to employment. The ADP survey showed that the private sector added 158K new jobs, below the expected 185K, while weekly unemployment claims for the week ended June 30th surged to 248K from previous 244K. A positive surprise came from the final services PMIs, as the official ISM index came in at 57.4, well above expectations of 56.5, whilst the Markit index jumped to 54.2 from an initial estimate of 53.0.
Speculative interest will now focus on the upcoming US NFP report to be release this Friday with the country expected to have added 179K new jobs in June, and the unemployment rate to remain steady at 4.3%. The worst-than-expected employment numbers released ahead of the report may lower the bar a bit, but anyway, seems unlikely that even with a positive surprise, the greenback can change course.
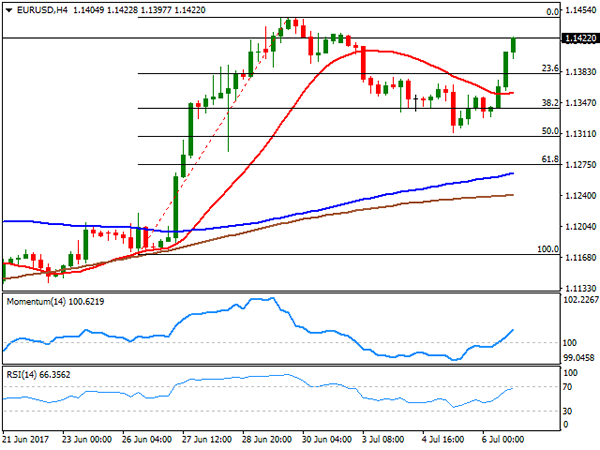
From a technical point of view, the pair remains around its daily high and not far from the yearly one set at 1.1445, with technical readings supporting additional advances, given that in the 4 hours chart, indicators maintain their strong upward momentum in positive territory, whilst the 20 SMA has turned higher below the current level. The pair has a strong static resistance in the 1.1460 level, with a break above it probably fueling the advance, at least short-term, towards the 1.1490 region first, an up to 1.1525 then.
Support levels: 1.1380 1.1340 1.1290
Resistance levels: 1.1460 1.1490 1.1525
USD/JPY
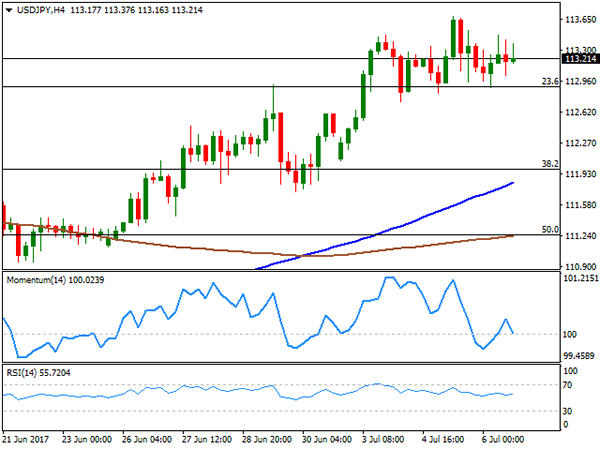
The USD/JPY pair ends the day barely higher for a second consecutive day, having been contained within Wednesday’s range, but holding near the twp-month high set this week and meeting buying interest on retracements towards 112.90, a Fibonacci support. The pair struggled for direction as poor US employment data should have sent it lower, but higher Treasury yields dented yen’s demand. Also, limiting the advance was the sour tone in worldwide equities as most major indexes closed in the red. Japan will release its preliminary May leading and coincident index during the upcoming Asian session, expected with the first expected above April’s figure, but the second below it. Technically, the pair presents a neutral-to-bullish stance in the short term, as in the 4 hours chart, the 100 and 200 SMAs keep advancing below the current level, with the shortest accelerating above the largest, but technical indicators have lost upward strength and hover around their mid-lines. Upcoming direction depends on the NFP outcome, with a huge positive surprise favoring an advance up to 114.40 a major static resistance area.
Support levels: 112.90 112.50 112.10
Resistance levels: 113.70 114.05 114.40
GBP/USD
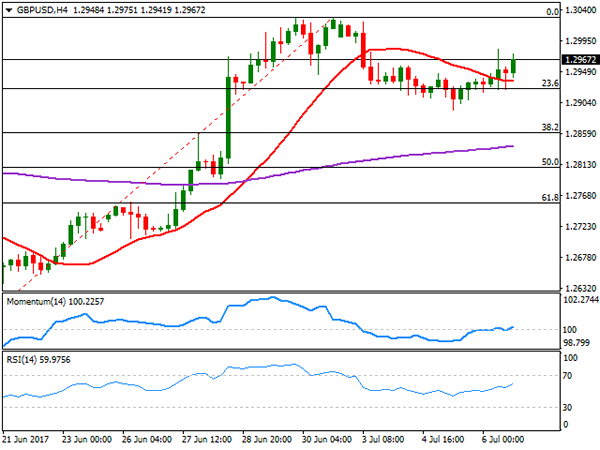
Broad dollar’s weakness and comments from BOE´s Ian McCafferty sent the GBP/USD pair to its highest in three days, with the pair settling near a daily high of 1.2983. Investors preferred to sell the American currency ahead of US employment data, particularly after some minor reports released this Thursday came worse-than-expected, while McCafferty said that raising rates would not only be justified, but also "prudent." He was one of three members of the MPC that voted for a hike in the latest meeting, surprising little markets, but backing the Pound anyway. The UK will release industrial and manufacturing May figures this Friday, alongside with the same month trade balance, which may set the tone for the pair, ahead of the US employment report. After correcting down to 1.2892 this week, the pair is now poised to resume its advance, although gains beyond the critical 1.3000 threshold are still in doubt, as the pair has been unable to sustain gains beyond it this year, topping in May at 1.3047. In the short term, the 4 hours chart shows that the price recovered after meeting buying interest around the 23.6% retracement of its latest daily rally at 1.2925, while also setting above the 20 SMA that lost its bearish strength. In the same chart, technical indicators aim modestly higher, with the RSI at 59, but the Momentum still stuck around its mid-line.
Support levels: 1.2925 1.2890 1.2860
Resistance levels: 1.2995 1.345 1.3080
GOLD
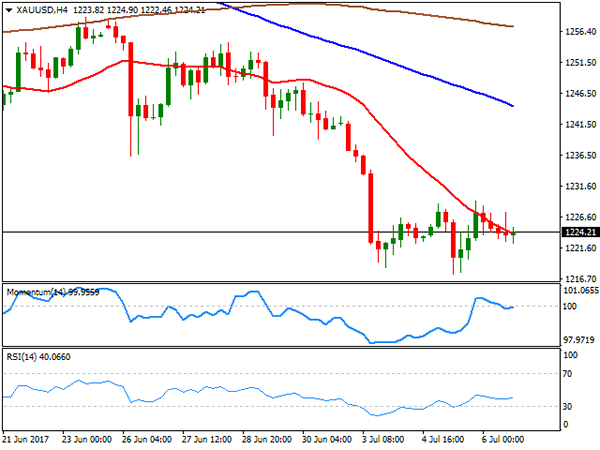
Spot gold closed the day at $1,224.10 a troy ounce, little changed for a third consecutive day, and with a modest advance supported by dollar and equities’ weakness. Speculative interest was left clueless after the latest FOMC Minutes showed that US policymakers are split on the rate hike outlook, hoping some clearer clues will surge from the US employment report to be released this Friday. The commodity heads into the Asian session near the 2-month low set at 1,217.40, now the immediate support, with a bearish tone according to technical readings, given that in the daily chart, the price remains far below its 20 and 100 DMAs, while hovering around its 100 DMA, as technical indicators resumed their declines within bearish territory. In the 4 hours chart, the price hovers around a bearish 20 SMA, unable to detach from it, while the Momentum indicator heads nowhere around its 100 level and the RSI indicator hovers around 40, all of which limits the upward potential. Still a disappointing US report may boost the commodity, with gains above 1.228.00 required to confirm additional gains ahead next week.
Support levels: 1,217.40 1,208.30 1,198.20
Resistance levels: 1,228.00 1,236.50 1,241.80
WTI CRUDE OIL
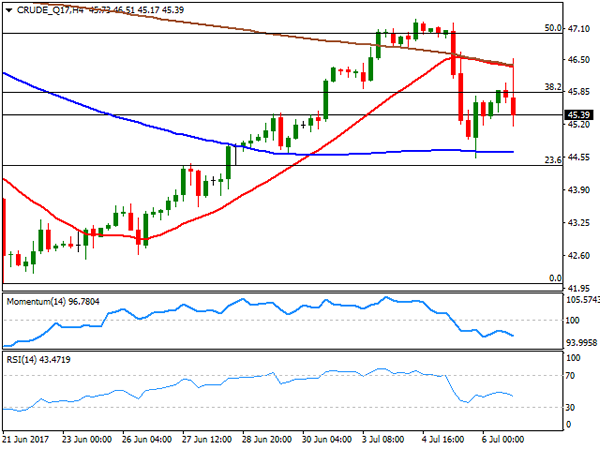
Crude oil prices surged over 2% intraday, but ended the day in the red, with West Texas Intermediate futures ending the day around $45.40 a barrel. WTI traded as high as 46.51, boosted by the EIA report that showed that US crude supplies dropped by 6.3 million barrels in the week ended June 30th, largely surpassing the 1.6 million barrels decline forecasted. The API report released late Wednesday also reported a slide of 5.76 million barrels. Gasoline investors also decline, by 3.7 million barrels. Yet at the end of the day, speculation that the worldwide glut will persist, weighed more. The daily chart shows that the price settled at the lower end of its Wednesday’s range, still above a flat 20 SMA, but below the 38.2% retracement of its latest decline, the immediate resistance at 45.90. The Momentum indicator in the mentioned chart aims marginally higher within neutral territory, while the RSI turned south, heading lower around 47. In the 4 hours chart, the technical outlook is bearish, with technical indicators heading sharply lower within negative territory and with the price having been rejected from convergent 20 and 200 SMAs at 46.60.
Support levels: 44.40 43.70 43.10
Resistance levels: 45.90 46.60 47.20
DJIA
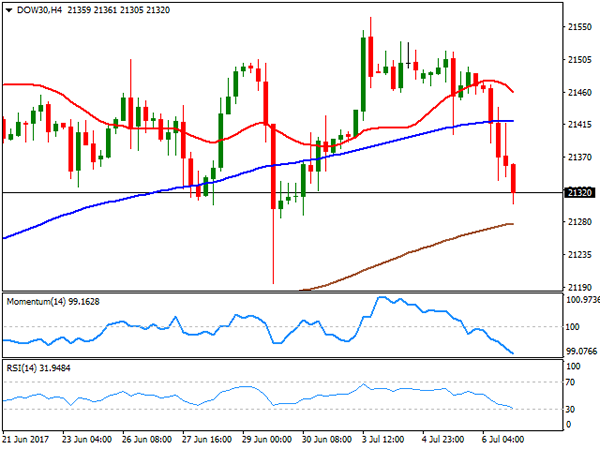
Wall Street plunged, with the Dow Jones Industrial Average posting a three-digit lost of 158 points, and settled at 21,320.04. The Nasdaq Composite shed 1.0%, or 61 points, and closed at 6,089.46, its lowest since mid May, while the S&P ended at 2,409.75, down by 22 points. The decline was led by technical and energy shares, while the negative tone of their overseas counterparts weighed on investors’ mood. Within the Dow, only two members closed up, El du Pont that added 0.42%, and Wall-Mart that closed 0.33% higher. General Electric on the other hand, led decliners, down 3.91%, followed by Intel that shed 1.99%. The daily chart for the DJIA shows that the index settled below its 20 DMA, whilst technical indicators entered bearish territory with a sharp downward slope, maintaining the risk towards the upside. In the 4 hours chart, technical indicators also head sharply lower, now nearing oversold territory, whilst the index accelerated further below its 20 and 100 SMAs. The 200 SMA stands as a key support at 21,278, with a break below it favoring a retest of last week’s low at 21,195.
Support levels: 21,305 21,278 21,228
Resistance levels: 21,361 21,417 21,459
FTSE100
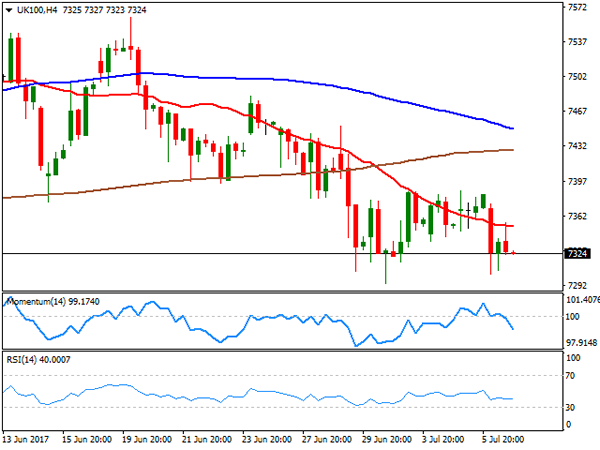
The FTSE 100 turned back south this Thursday, ending the day down 30 points at 7,337.28, following the lead of its European counterparts, undermined by new evidence that the ECB is on its way towards a tighter economic policy. The mining sector led the way lower within the Footsie, with Glencore leading decliners with a 2.52% loss, followed by Fresnillo that shed 2.45%. Associated British Foods was the best performer, up 2.57%, followed by Barclays that added 2.42%. The technical outlook for the index is bearish, as in the daily chart, it fell sharply from its 100 DMA, currently at 7,372, whilst technical indicators head south within bearish territory. Shorter term, and according to the 4 hours chart, the risk is also towards the downside, with the index contained by a bearish 20 SMA, the Momentum indicator heading sharply lower within bearish territory, and the RSI indicator heading south around 39, all supporting further declines on a break below the weekly low of 7,327.
Support levels: 7,327 7,294 7,256
Resistance levels: 7,372 7,424 7,452
DAX
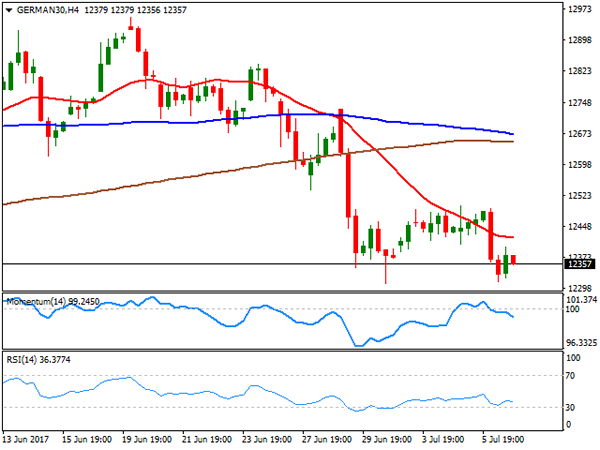
The German DAX closed the day at 12,381.25, down 72 points or 0.58%, with European indexes dragged lower by industrial and pharmaceutical equities. Receding dollar’s demand pushed local currencies higher, alongside with speculation of upcoming monetary policy tightening, also weighing on local shares. Within the DAX, only five members closed higher, with Volkswagen leading the advance with a 1.31% gain, followed by Commerzbank that added 1.23%. ProSiebenSat.1 led decliners, down 4.06%, followed by Bayer that shed 2.29%. The index fell further in after-hours trading, entering the Asian session around 12,350 and with a strongly bearish technical stance, as in the daily chart, the index is pressuring its 100 DMA, whilst technical indicators resumed their declines, now nearing oversold levels. In the 4 hours chart, technical readings also favored the downside, as the benchmark stands below a bearish 20 SMA, whilst technical indicators also head south within bearish territory.
Support levels: 12,310 12,272 12,239
Resistance levels: 12,398 12,445 12,490