EUR/USD
The EUR/USD pair closed the week marginally lower around 1.1400, as the dollar got help from a mixed US employment report that anyway is not enough to change the ongoing negative sentiment towards the American currency, as poor wages’ growth keeps casting doubts over Fed’s ability to keep on raising rates. The ECB account of the latest policy meeting, on the other hand, gave the common currency a boost on Thursday, as policy makers discussed the possibility of dropping the pledge to expand their bond-purchase programme if necessary, with the market seeing that as a step forward in the tightening path. The central bank finally decide to maintain it, waiting for higher inflation.
As for US employment data released on Friday, the economy added 222,000 new jobs in June, surpassing expectations, although the unemployment rate ticked higher, to 4.4% from previous 4.3%, whilst wages grew below market’s expectations, up just by 0.2% in the month. The upcoming week will be quite busy in the data front, with inflation in the US topping the list of market movers for the pair.
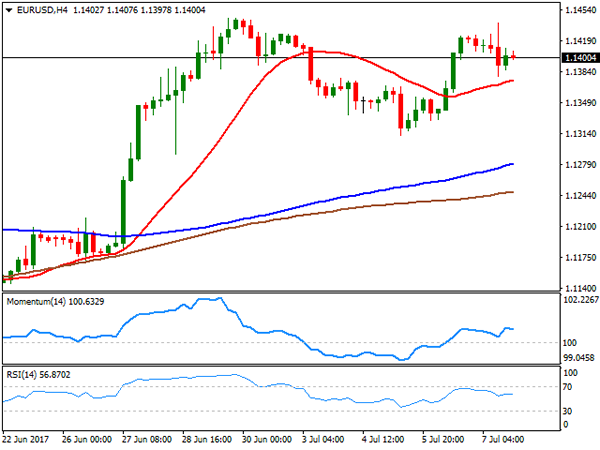
Technically, the daily chart shows that the pair topped around 1.1440 for a second consecutive week, whilst technical indicators have begun easing from oversold levels, but are far from confirming an upcoming reversal, moreover as the price remains well above all of its moving averages, which continue heading north. The short term picture is quite alike with indicators pulling back modestly within positive territory, but the price above bullish moving averages. Declines will remain corrective as long as buying interest defends the 1.1290 region, the neckline of the mentioned double top figure. To the upside, a long term resistance stands at 1.1460, with large stops probably gathering above it.
Support levels: 1.1380 1.1340 1.1290
Resistance levels: 1.1460 1.1490 1.1525
USD/JPY
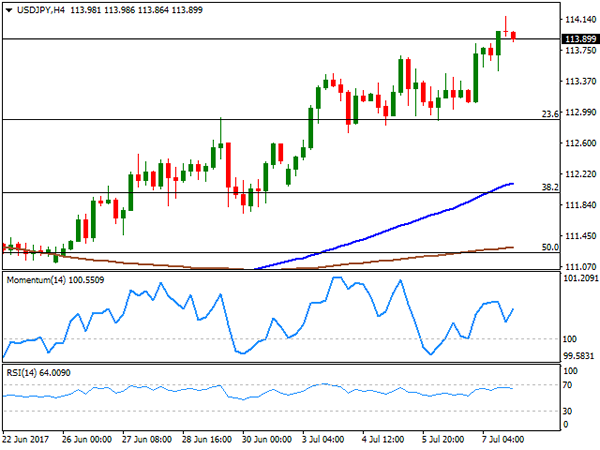
The USD/JPY pair’s advance extended to 114.17 last week, its highest since May 11th, with the pair up for a fourth consecutive week. Dollar gains were backed by surging yields worldwide, on fresh signals that central banks’ are moving away from ease-oriented monetary policies. On Thursday, the German bund 10-year yield rose to its highest in 18 months, after the ECB unveiled that discussed removing the easing bias from their statement in their latest meeting. In the US, the 10-year note benchmark rose to 2.39%, its highest in two months. Over the weekend, news hit the wires that the BOJ will cut its inflation forecast, while maintaining the current stimulus in their upcoming meeting, according to "people familiar with the matter." The news can see the JPY regaining ground this Monday, particularly as demand for the USD remains limited. From a technical point of view, the daily chart shows that the positive stance persists, as the price has extended its advance beyond a bullish 200 DMA, although the 100 DMA keeps heading south below the largest. In the same chart, technical indicators head north near overbought levels. Shorter term, and according to the 4 hours chart, the technical outlook is also positive, with the RSI indicator consolidating near 64 and the Momentum heading higher, but below previous highs. The pair has a strong static resistance around 114.40, with a break above it signaling further gains ahead.
Support levels: 113.50 113.10 112.65
Resistance levels: 114.05 114.40 114.75
GBP/USD
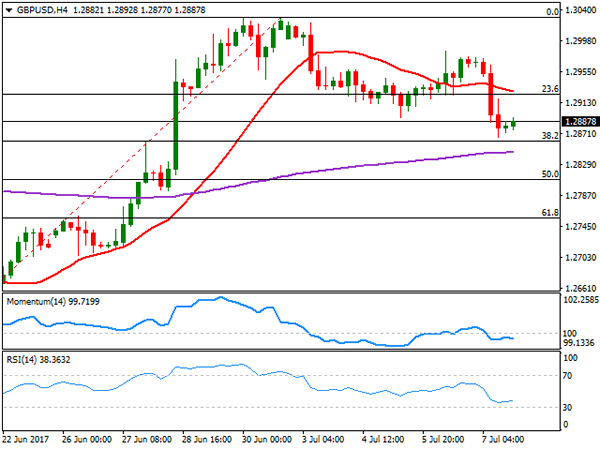
The Pound edged lower against all of its major rivals on Friday, as worse-than-expected industrial and manufacturing production figures for May point to weaker growth of the UK economy, with the first down 0.1% and the second 0.2%, while construction output also fell in the month, and the trade balance’s deficit widened more than expected, to £3.796B. The numbers cooled down expectations of a tighter monetary policy, resulting in the GBP/USD pair breaking below the 1.2900 level. US mixed employment data had little effect on the pair, but prevent it from recovering ground. The pair has an immediate support at 1.2860, the 38.2% retracement of the 1.2588/1.3029 rally from late June, with technical indicators heading lower within bearish territory, and the 20 DMA heading north below the mentioned Fibonacci support. Overall, the downward move remains corrective, albeit below the mentioned static support, the pair has room to extend its decline down towards 1.2750, the 61.8% retracement of the same rally. In the 4 hours chart, the scale leans towards the downside, as the 20 SMA gains bearish strength above the current level, while technical indicators hold within bearish territory, with limited directional strength.
Support levels: 1.2860 1.2820 1.2785
Resistance levels: 1.2925 1.2960 1.3000
GOLD
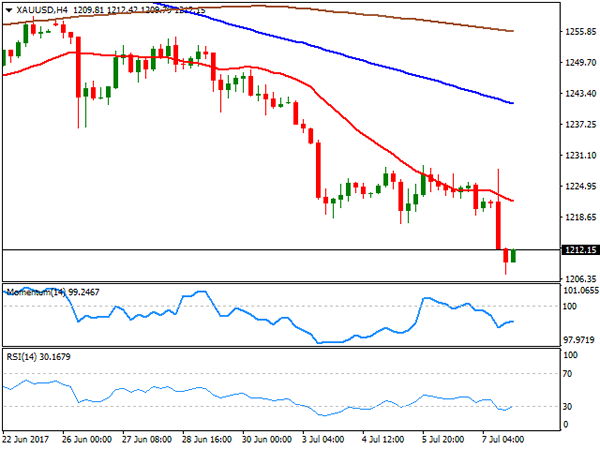
Gold prices fell further on Friday, with spot ending the week at $1,212.15, its lowest settlement in four months, following a mixed US employment report. A strong jobs’ creation was balanced with poor wages’ growth, not enough to deviate the Fed’s from its tightening path, albeit uncertainty remains strong on the case. US inflation data, to be released this week, can shed some light over the matter and determinate gold’s trend. Also, denting sentiment towards the commodity is the latest flip in central banks’ stance, now inclined to tighten their monetary policies. The technical picture for the safe-haven is bearish according to the daily chart, with the price having extended its decline below the 200 DMA and indicators heading south near oversold readings. Shorter term, the 4 hours chart shows that a bearish 20 SMA keeps capping the upside, currently at 1,222.10, while the RSI indicator has managed to correct partially oversold readings, while the Momentum indicator lost upward strength well below its mid-line.
Support levels: 1,207.24 1,198.20 1,189.90
Resistance levels: 1,222.10 1,228.00 1,236.50
WTI CRUDE OIL
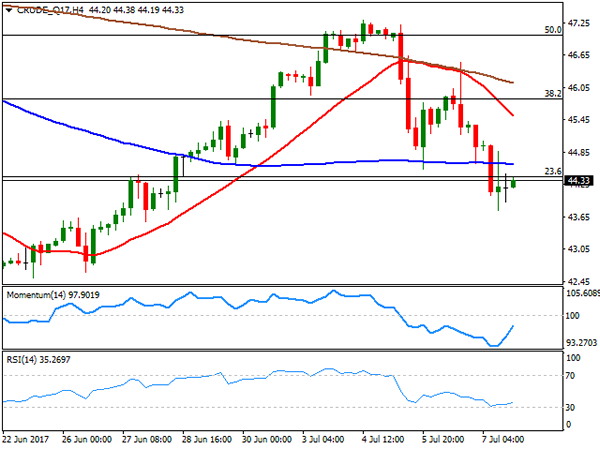
Crude oil prices closed the week in the red, with West Texas Intermediate futures down to $44.33 a barrel, shedding roughly 3% this past week, amid persistent fears of a global glut, and news that Russia is not willing to back further OPEC’s output cuts. US government data released last Thursday showed that, despite crude oil stockpiles fell by 6.3 million, oil production rose on1.0% to 9.34 million barrels per day. Additionally, the Baker Hughes report released on Friday showed that the number of US active rigs drilling for oil rose by 7 to 763 last week. The daily chart for WTI shows that the price settled below its 20 SMA, and around the 23.6% retracement of its latest bearish run, after correcting half of the decline in the previous week, increasing chances of a downward extension. In the same chart, the Momentum indicator holds flat within positive territory, but the RSI indicator also supports a downward move by heading south around 41. In the 4 hours chart, the price settled below all of its moving averages, while technical indicators bounced from oversold levels, heading higher within positive territory, not enough to support a recovery.
Support levels: 43.70 43.10 42.60
Resistance levels: 44.80 45.50 46.10
DJIA
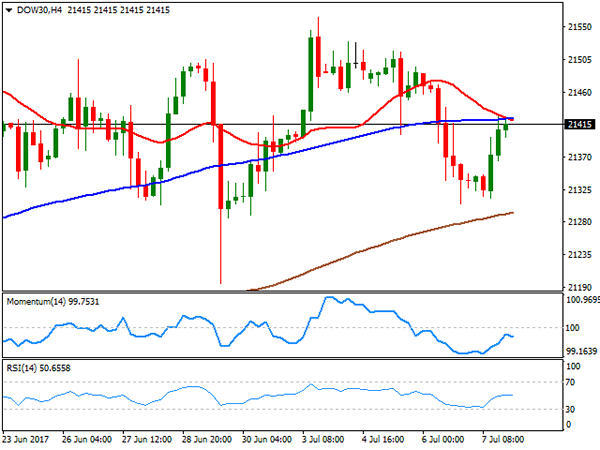
US indexes surged on Friday, ending the week with gains, helped the employment report released on Friday, indicating strong jobs’ creation in June, and despite soft wages arise doubts over upcoming rate hikes. The Dow Jones Industrial Average added 94 points, to settle at 21,414.34, while the Nasdaq Composite gained 63 points, to 6,153.08. The S&P closed at 2,425.18, up 0.64%. Within the Dow, Goldman Sachs led decliners with a 0.62% loss, followed by General Electric that shed 0.61% and Chevron, this last hit by oil’s decline. McDonald’s led advancers, up 2.08%, followed by Nike that gained 1.43%. The daily chart for the DJIA shows that the index closed right around its 20 DMA, unable to recover above it, but far above the larger ones, whilst technical indicators turned higher within neutral territory. In the 4 hours chart, the advance was contained by the 20 and 100 SMAs, both converging around 21,420, whilst technical indicators recovered from oversold readings, but lost upward momentum below their mid-lines, limiting chances of a stronger advance in the short term.
Support levels: 21,366 21,305 21,278
Resistance levels: 21,420 21,459 21,515
FTSE100
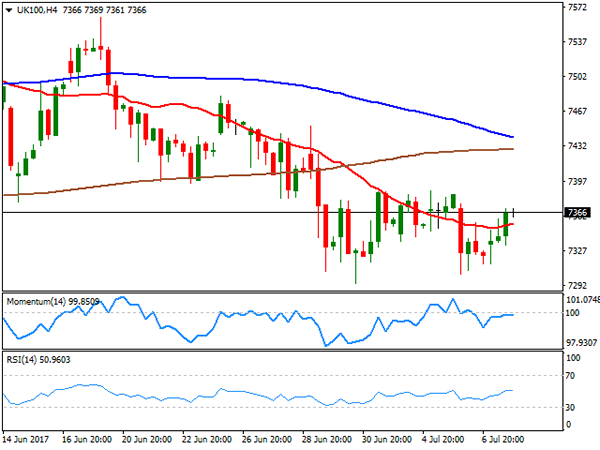
The FTSE 100 found support in a weaker Pound last Friday, ending the day up 13 points or 0.19%, at 7,350.92. The mining sector edged lower on gold and silver weakness, with Fresnillo and Randgold Resources shedding over 1.0% each. EasyJet was the best performer, up 5.35%, followed by Centrica that added 2.87% on rumors of a takeover of the company. Royal mail led decliners, ending the day down 3.35%, while ITV shed 2.91%. The index remains biased lower according to technical readings, as in the daily chart, the recovery stalled below the 100 DMA while the 20 SMA extended its downward move above the largest. Indicators in the mentioned chart remain within negative territory with little directional strength. In the 4 hours chart, technical indicators have turned horizontal below their mid–lines, while the index settled a few points above a bullish 20 SMA, yet below the 100 and 200 SMAs, indicating limited buying interest.
Support levels: 7,327 7,294 7,256
Resistance levels: 7,372 7,424 7,452
DAX
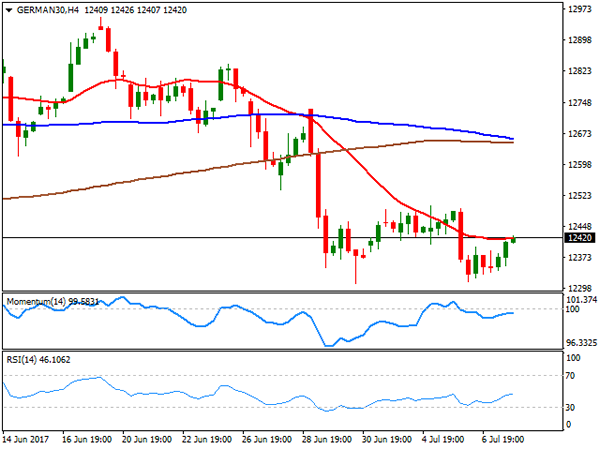
European equities closed mostly lower on Friday, as persistent weakness in oil prices weighed, although the German DAX managed to close the day at 12,388.68, up by 7 points. Speculation that the easing monetary policy is getting closer to an end, undermined investors’ confidence despite the economic recovery, indicating that stocks may remain under pressure this week. Within the German benchmark, ProSiebenSat.1 led decliners for a second consecutive session, down 1.29%, and followed by Commerzbank that shed 0.52%. RWE AG was the best performer, up 3.72%, followed by E.ON that added 2.55%. The index has held once again above a bullish 100 DMA in the daily chart, but remains nearby, and with technical indicators holding near oversold readings, which increase the risk of further declines ahead. In the 4 hours chart, the latest recovery was contained by a now flat 20 SMA, with the index holding around it, while technical indicators consolidate below their mid-lines, limiting chances of a steeper recovery. The index bottomed at 12,310 this past week, the level to break to confirm a new leg lower.
Support levels: 12,366 12,310 12,272
Resistance levels: 12,445 12,490 12,536