
The EUR/USD currency pair
Technical indicators of the currency pair:
Prev Open: 1.10940
Open: 1.10583
% chg. over the last day: -0.24
Day’s range: 1.10555 – 1.10642
52 wk range: 1.0879 – 1.1572
The EUR/USD currency pair retreated from local highs after a sharp rally last week. The demand for greenback resumed after the release of optimistic statistics on business activity in the US manufacturing sector. At the moment the technical picture is ambiguous. The trading instrument is consolidating in the range of 1.10400-1.10650. Financial markets participants are waiting for additional drivers. It is recommended to open positions from key levels.
Today the news background is quite calm. At 17:00 (GMT+2:00) a report on industrial orders volume in the USA will be published.
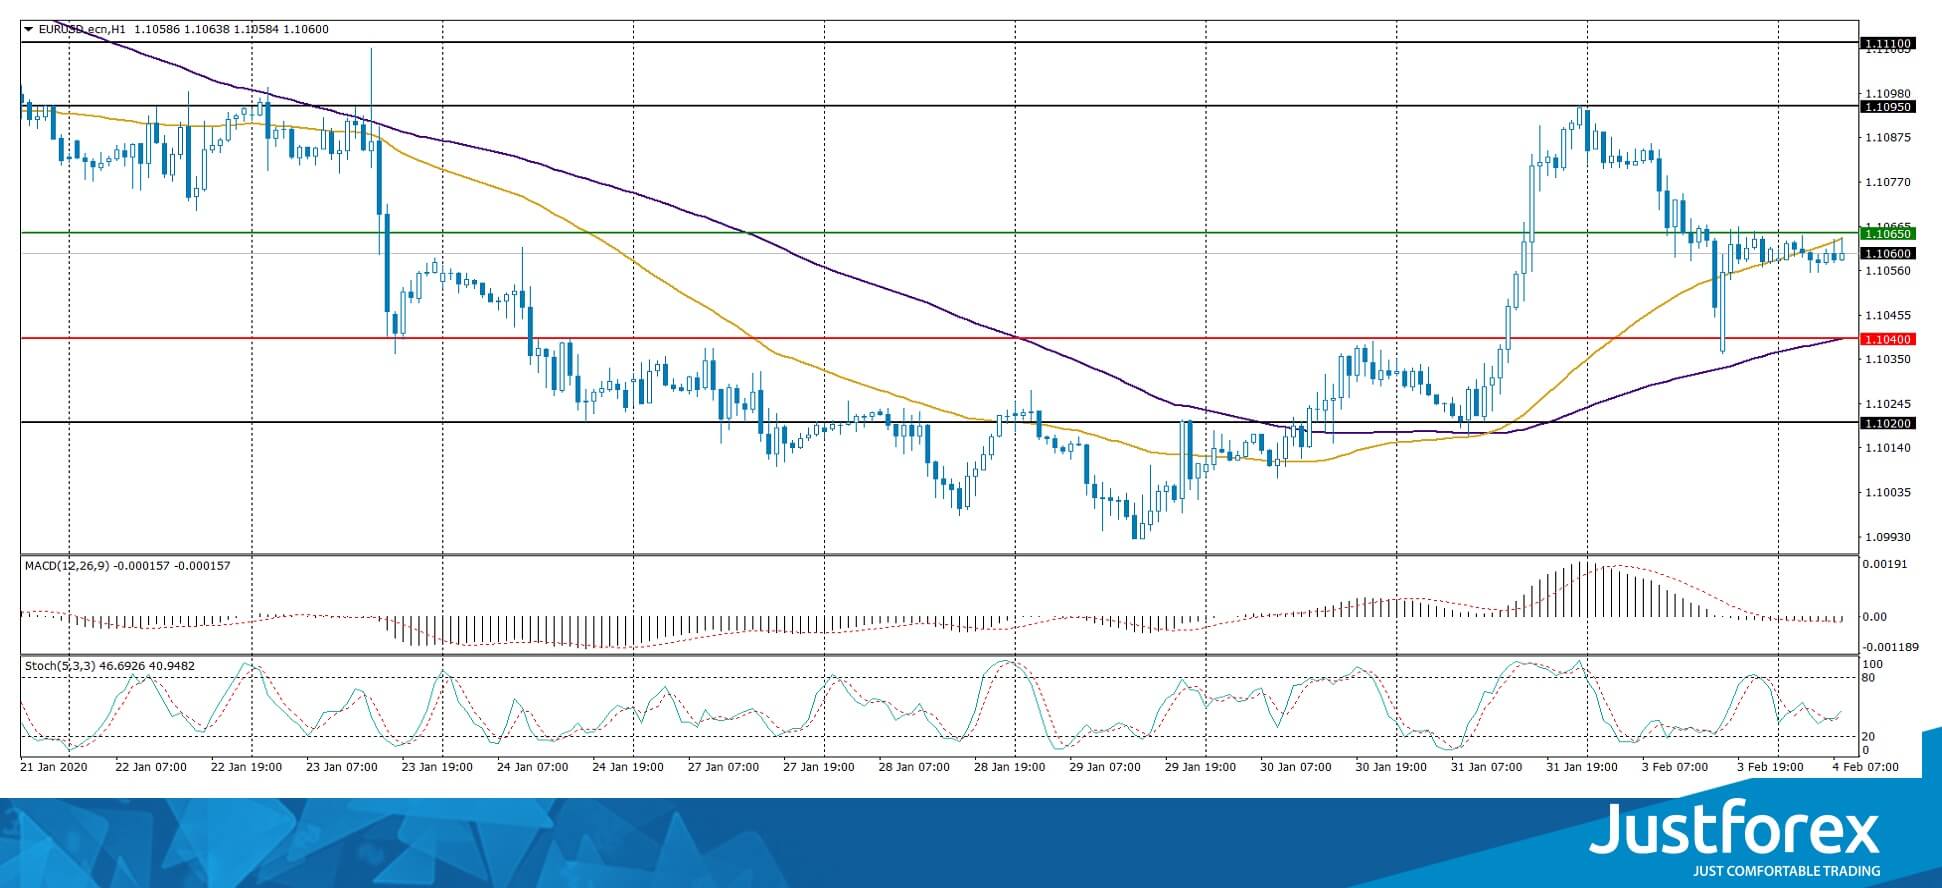
Indicators do not give accurate signals: the price has crossed 50 MA.
MACD histogram is near the 0 mark.
The Stochastic Oscillator is located in the neutral zone, the %K line has crossed the %D line. There are no signals at the moment.
Trading recommendations
Support levels: 1.10400, 1.10200, 1.10000
Resistance levels: 1.10650, 1.10950, 1.11100
If the price fixes above 1.10650, expect the quotes to rise toward 1.10900-1.11200.
Alternatively, the quotes could descend toward 1.10200-1.10000.
The GBP/USD currency pair
Technical indicators of the currency pair:
Prev Open: 1.31703
Open: 1.29894
% chg. over the last day: -1.40
Day’s range: 1.29812 – 1.30238
52 wk range: 1.1959 – 1.3516
Aggressive sales dominate GBP/USD currency pair. During yesterday’s trading the drop exceeded 180 points. Sterling was under pressure after Boris Johnson’s comments. The Prime Minister said that Great Britain is not going to adhere to the EU trade standards after Brexit. At the moment GBP/USD quotes are consolidating in the range 1.29800-1.30250. The trading instrument has a potential for further decline. Positions need to be opened from key levels.
The Economic News Feed for 04.02.2020:
UK Construction Business Index – 11:30 (GMT+2:00);
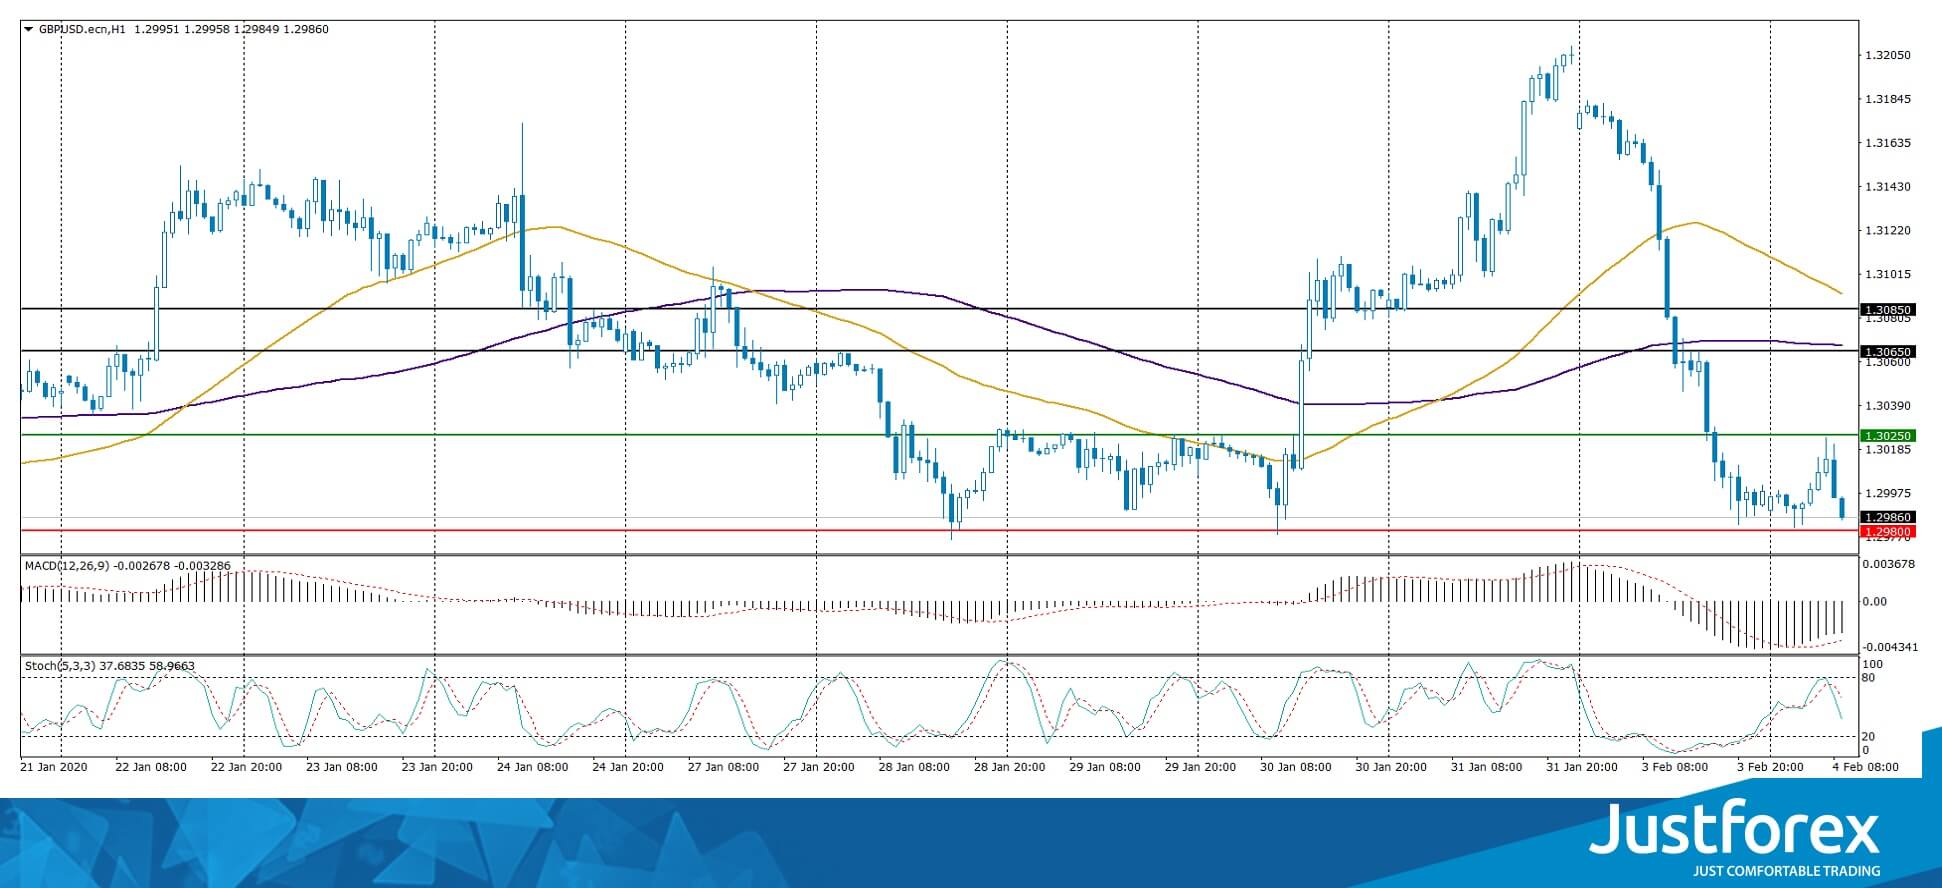
The indicators signal the sellers’ strength: the price has fixed below 100 MA.
The MACD histogram is in the negative zone, but above the signal line, which gives a weak signal to sell GBP/USD.
The Stochastic Oscillatoris in the neutral zone, the %K line is below the %D line, which indicates a bearish mood
Trading recommendations
Support levels: 1.29800, 1.29400
Resistance levels: 1.30250, 1.30650, 1.30850
If the price fixes below 1.29800, GBP/USD quotes are expected to fall further to 1.29400-1.29200.
Alternatively, they could grow to 1.30500-1.30800.
The USD/CAD currency pair
Technical indicators of the currency pair:
Prev Open: 1.32360
Open: 1.32869
% chg. over the last day: +0.41
Day’s range: 1.32867 – 1.33019
52 wk range: 1.2949 – 1.3566
USD/CAD quotes continue to show a stable upward trend. The trading instrument reached the round level of 1.33000. The mark 1.32500 is already a mirror support. The CAD is under pressure from aggressive sales in the oil market. However, the technical correction of the USD/CAD currency pair after the prolonged rally is not ruled out in the nearest future. Positions should be opened from key levels.
The Economic News Feed for 04.02.2020 is calm.
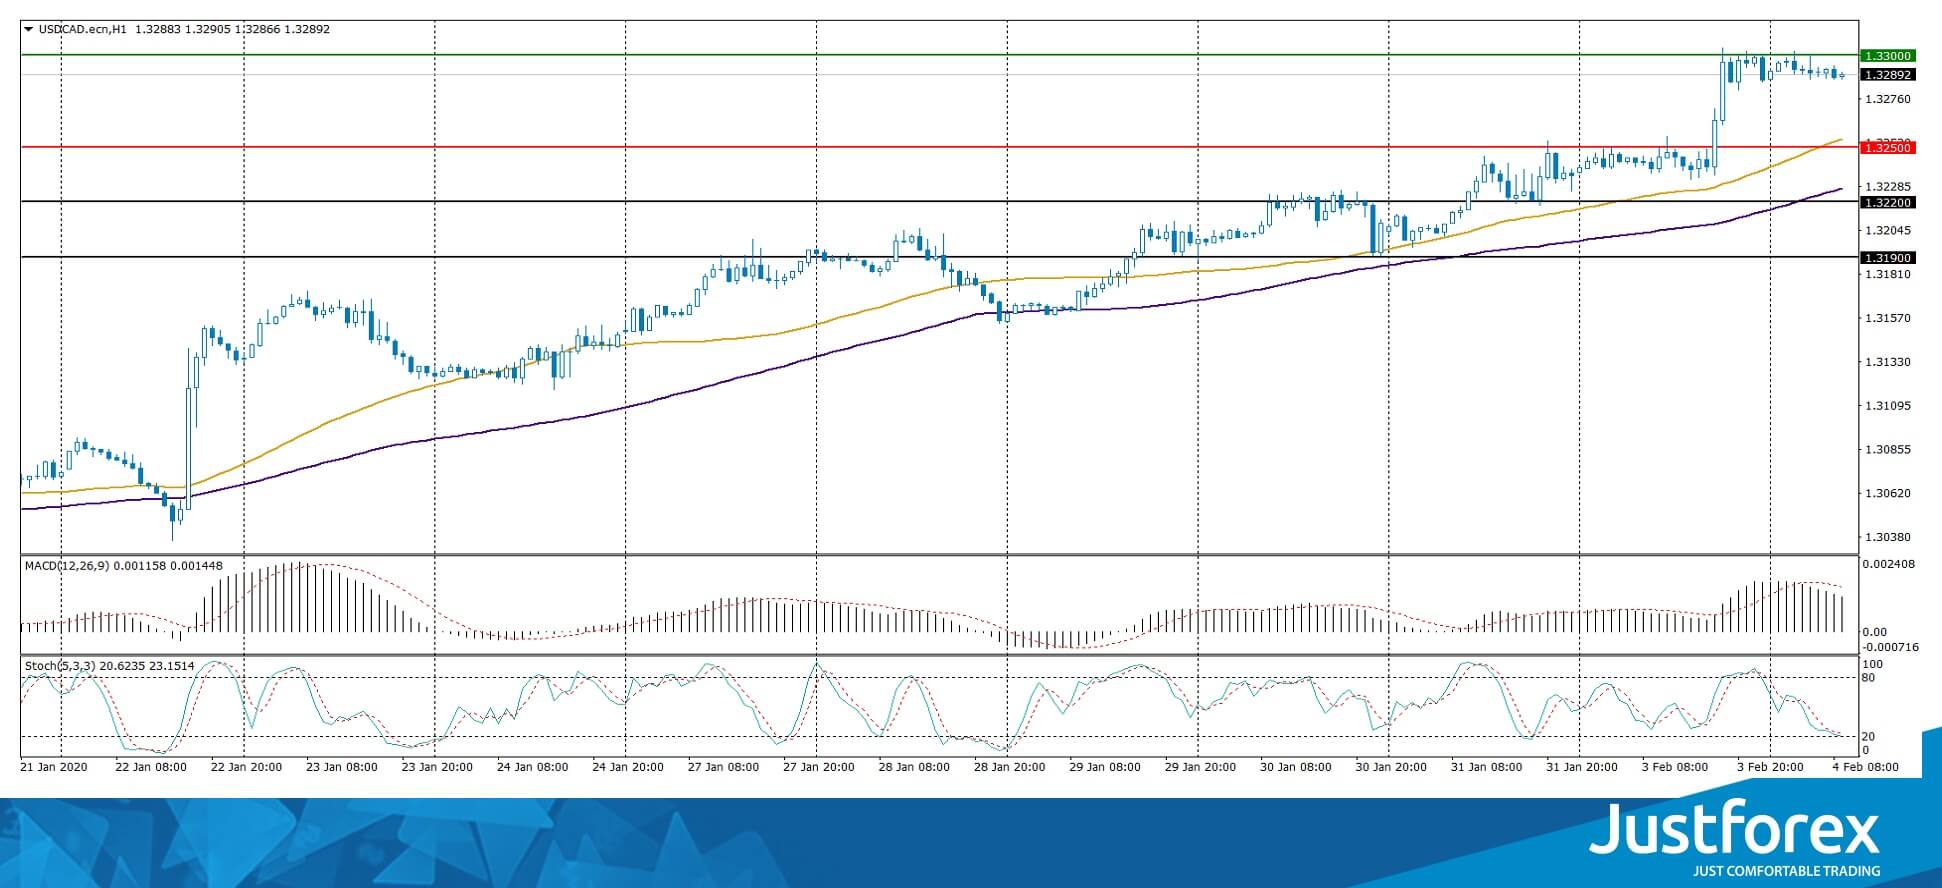
The indicators signal the strength of buyers: the price has fixed above 50 MA and 100 MA.
MACD histogram is in the positive zone, which indicates a bullish sentiment.
The Stochastic Oscillator is located near the oversold area, the %K line is below the %D line, which gives a weak signal to sell USD/CAD.
Trading recommendations
Support levels: 1.32500, 1.32200, 1.31900
Resistance levels: 1.33000, 1.33400
If the price fixes above 1.33000, expect further growth toward 1.33300-1.33500.
Alternatively, the quotes could correct toward 1.32200-1.31900.
The USD/JPY currency pair
Technical indicators of the currency pair:
Prev Open: 108.450
Open: 108.687
% chg. over the last day: +0.21
Day’s range: 108.548 – 108.934
52 wk range: 104.45 – 113.53
The USD/JPY currency pair has an ambiguous technical picture. At the moment the trading instrument is in sideways movement. Local support and resistance levels are at 108.600 and 108.950, respectively. USD/JPY quotes have a potential for recovery. We recommend you to pay attention to the US government securities yield dynamics. Positions should be opened from key levels.
The Economic News Feed for 04.02.2020 is calm.
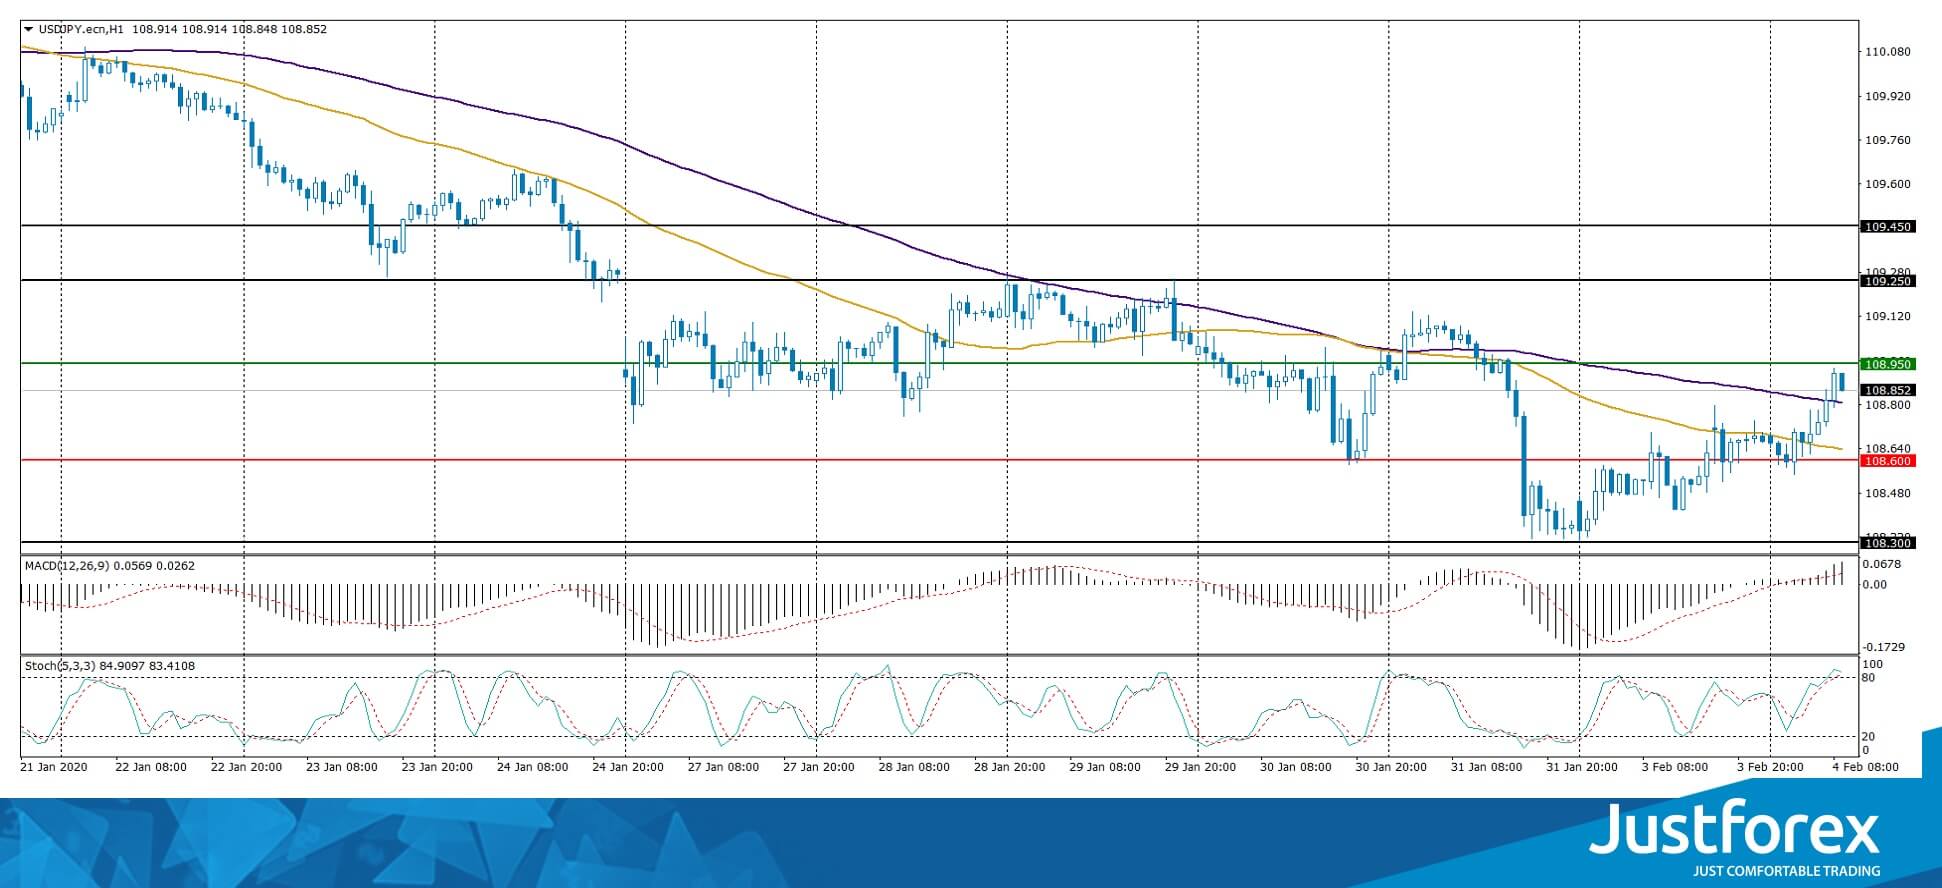
Indicators do not give accurate signals: the price has crossed 50 MA and 100 MA.
Histogram of MACD has crossed to the positive zone, which indicates the development of bullish sentiments.
The Stochastic Oscillator is located in the overbought zone, the %K line has crossed the %D line. No signals at the moment.
Trading recommendations
Support levels: 108.600, 108.300, 108.000
Resistance levels: 108.950, 109.250, 109.450
If the price fixes above 108.950, expect the quotes to rise toward 109.250-109.450.
Alternatively, the quotes could descend toward 108.350-108.000.


