The New Zealand Dollar has continued to edge lower against the Japanese Yen. The currency pair declined by 1.83% in value during last week’s trading sessions.
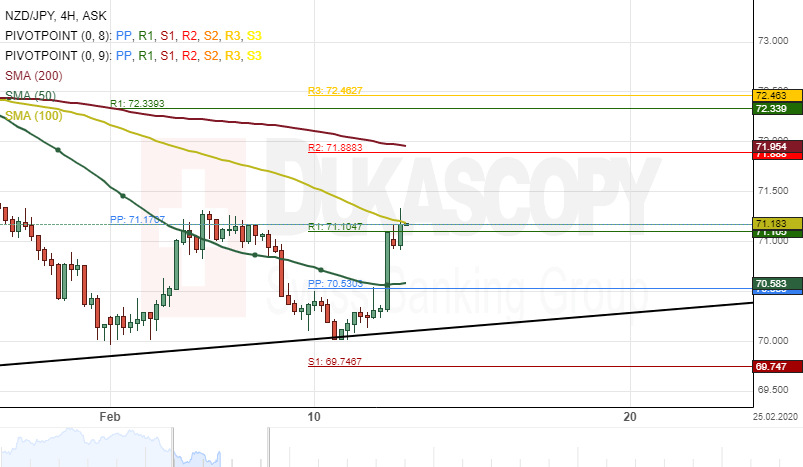
Currently, the exchange rate is testing a resistance cluster formed by the 100– period simple moving average and the combination of the weekly R1 and the monthly pivot point at 71.21.
If the resistance cluster holds, the NZD/JPY pair will likely continue to trade south within this week’s trading sessions.
However, if the currency exchange rate breaks the cluster, a surge towards the 73.00 marks could be expected in the nearest future.