
The EUR/USD currency pair
Technical indicators of the currency pair:
Prev Open: 1.08405
Open: 1.08404
% chg. over the last day: -0.01
Day’s range: 1.08336 – 1.08417
52 wk range: 1.0879 – 1.1572
The EUR/USD currency pair has stabilized after a prolonged decline. At the moment the trading instrument is consolidating near the three-year lows. The local support and resistance levels are 1.08250 and 1.08650, respectively. Investors are concerned about the weakening of economic growth in Europe. The financial markets continue to be under pressure from the rapidly spreading coronavirus in China. Nevertheless, we do not rule out technical correction of EUR/USD quotes in the nearest future. We recommend opening positions from key levels.
No important economic releases are planned today. The US financial markets are closed due to the holiday.
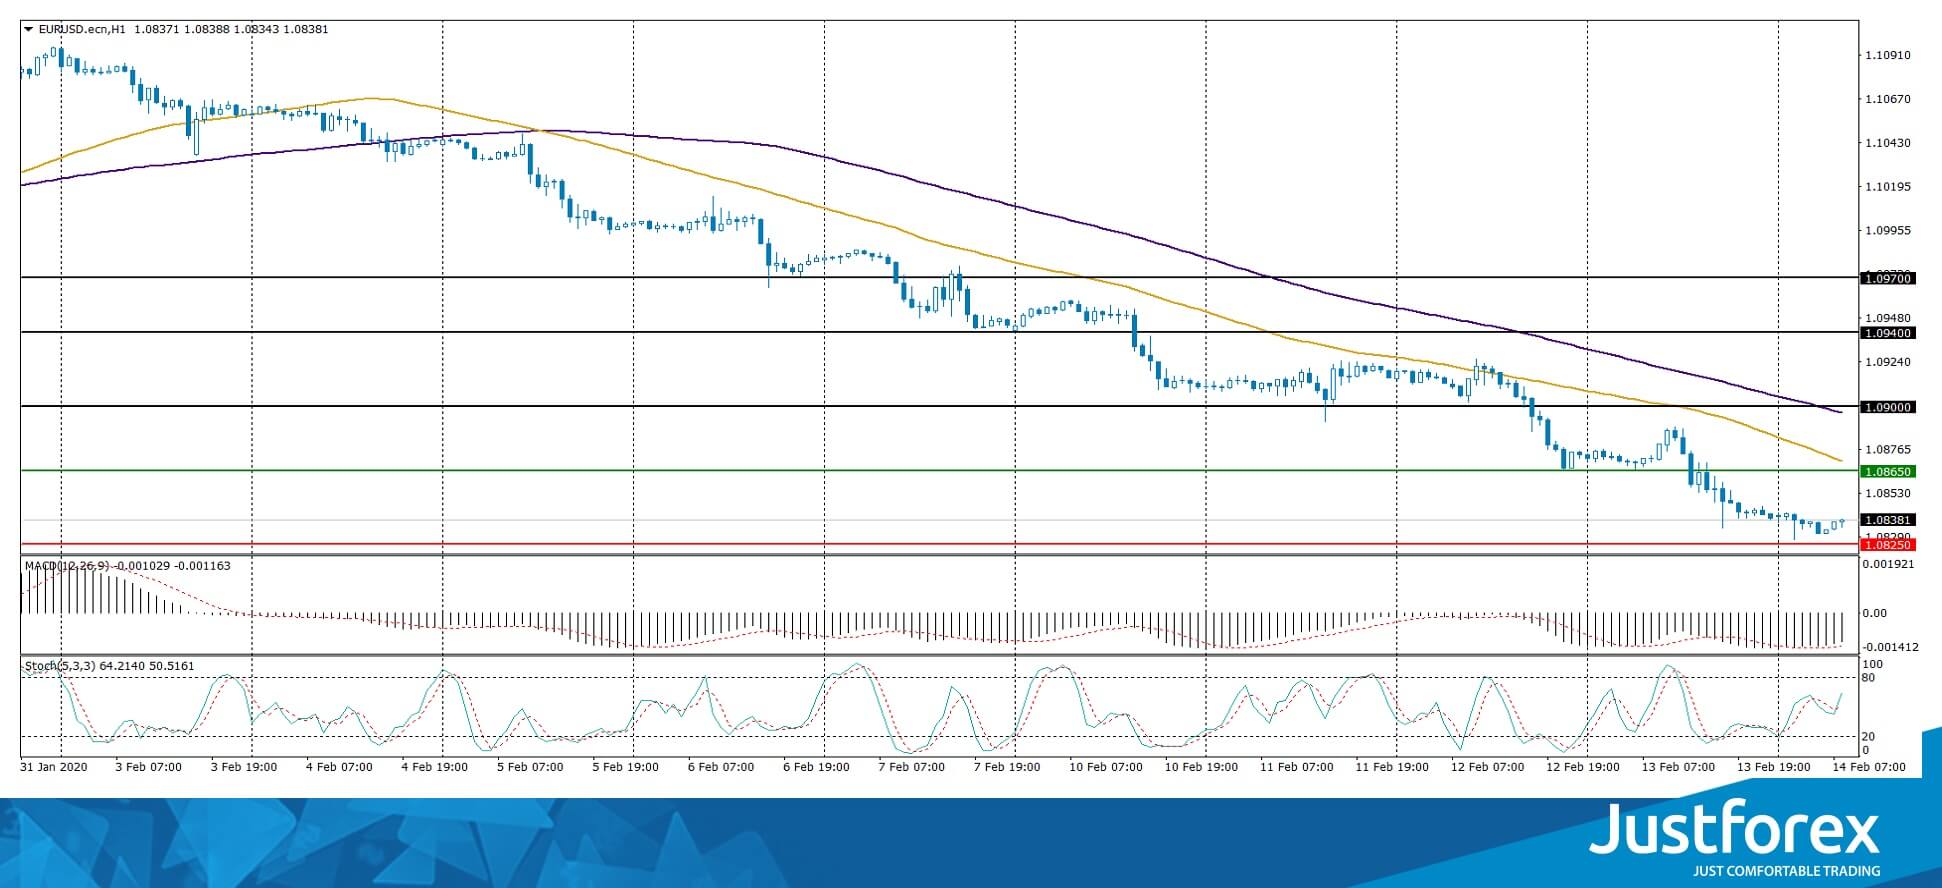
The indicators signal the sellers’ strength: the price has fixed below 50 MA and 100 MA.
The MACD histogram is in the negative zone, which indicates a bearish sentiment.
The stochastic oscillator is in the neutral zone, the %K line has crossed the %D line. There are no signals at the moment.
Trading recommendations
Support levels: 1.08250, 1.08000
Resistance levels: 1.08650, 1.09000, 1.09400
If the price fixes below 1.08250, further decline of EUR/USD quotes is expected to 1.08000-1.07700.
Alternatively, the quotes could grow to 1.09000-1.09200.
The GBP/USD currency pair
Technical indicators of the currency pair:
Prev Open: 1.30422
Open: 1.30322
% chg. over the last day: -0.08
Day’s range: 1.30260 – 1.30536
52 wk range: 1.1959 – 1.3516
GBP/USD quotes are in a flat. There is no defined trend. Sterling is testing key support and resistance levels: 1.30100 and 1.30650, respectively. Financial markets participants are waiting for additional drivers. GBP/USD currency pair has potential for further growth. Positions should be opened from key levels.
The news background on the UK economy is calm.
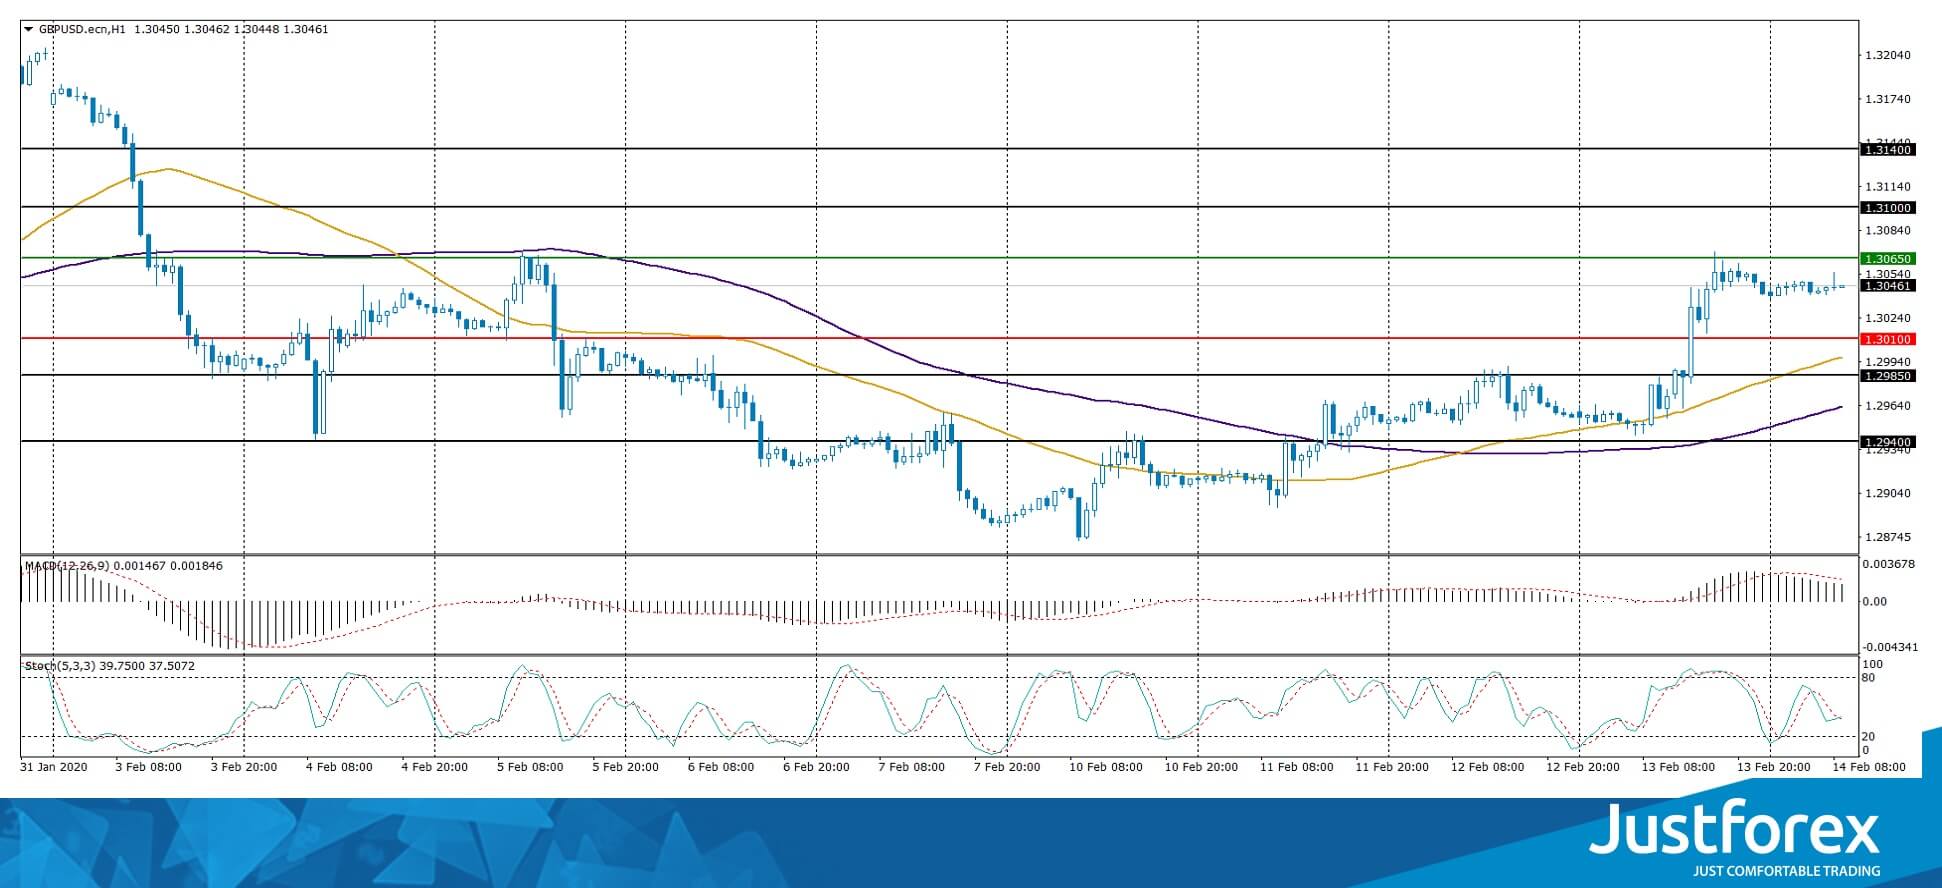
The indicators point to the strength of buyers: the price has fixed above 50 MA and 100 MA.
The MACD histogram is in the positive zone but below the signal line, which gives a weak signal to buy GBP/USD.
The Stochastic Oscillator is in the neutral zone, the %K line is below the %D line, which indicates a bearish sentiment.
Trading recommendations
Support levels: 1.30100, 1.29850, 1.29400
Resistance levels: 1.30650, 1.31000, 1.31400
If the price fixes above 1.30650, expect the quotes to grow toward 1.31000-1.31200.
Alternatively, the quotes could descend toward 1.29700-1.29500.
The USD/CAD currency pair
Technical indicators of the currency pair:
Prev Open: 1.32665
Open: 1.32500
% chg. over the last day: -0.11
Day’s range: 1.32337 – 1.32508
52 wk range: 1.2949 – 1.3566
USD/CAD currency pair continues to trade in Flat. There is no defined trend. At the moment, local support and resistance levels are acting: 1.32350 and 1.32600, respectively. The trading instrument has a potential for further decline. We recommend you to pay attention to the oil price dynamics. Positions should be opened from key levels.
The Canadian financial markets are closed due to the holiday.
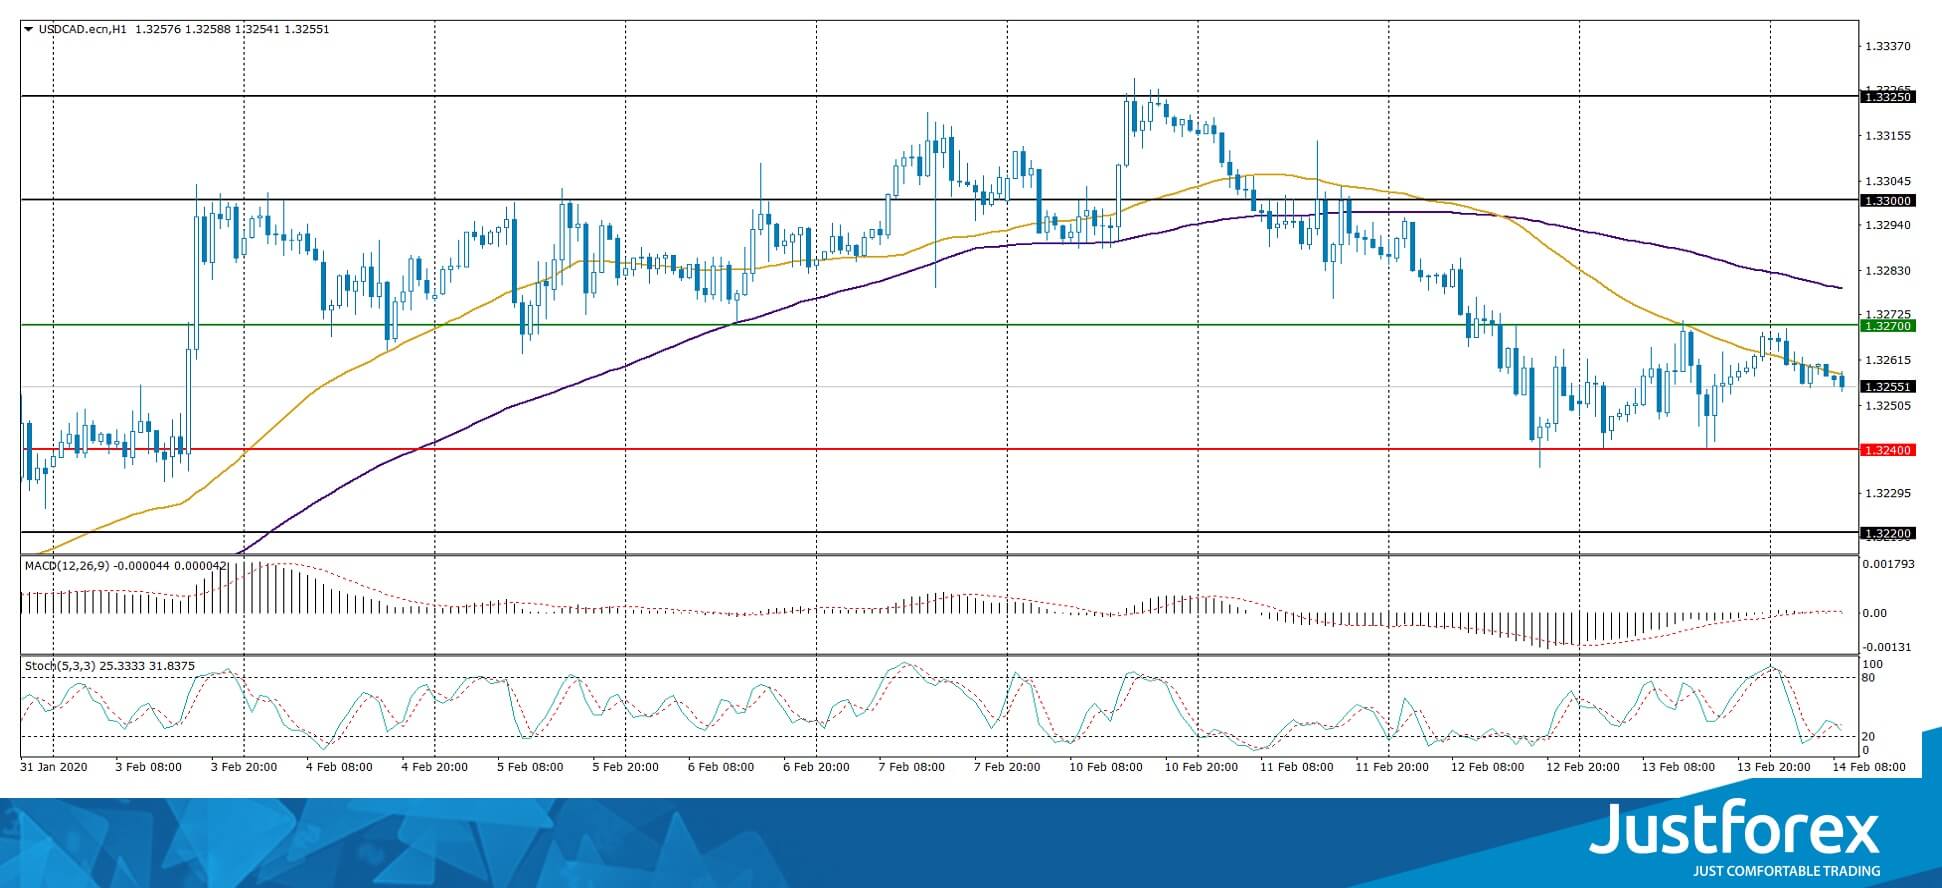
The indicators signal the sellers’ strength: the price has fixed below 50 MA and 100 MA.
The MACD histogram is in the negative zone, which indicates a bearish sentiment.
The Stochastic Oscillator is located in the oversold area, the %K line crossed the %D line. There are no signals at the moment.
Trading recommendations
Support levels: 1.32350, 1.32000
Resistance levels: 1.32600, 1.32800, 1.33000
If the price fixes below 1.32350, expect further correction toward 1.32000.
Alternatively, expect growth toward 1.3200-1.33000.
The USD/JPY currency pair
Technical indicators of the currency pair:
Prev Open: 109.813
Open: 109.846
% chg. over the last day: +0.04
Day’s range: 109.719 – 109.853
52 wk range: 104.45 – 113.53
The Japanese yen continues to be traded in a long flat. The technical pattern is ambiguous. Currently, the following local support and resistance levels can be distinguished: 109.600 and 109.900, respectively. Investors are waiting for additional drivers. We recommend you to keep track of current information about the epidemic in China. Positions should be opened from key levels.
Yen is under pressure due to a weak report on Japanese GDP. According to preliminary data, in the fourth quarter growth slowed down by 1.6% (QoQ). Experts predicted a decline by 0.9%.
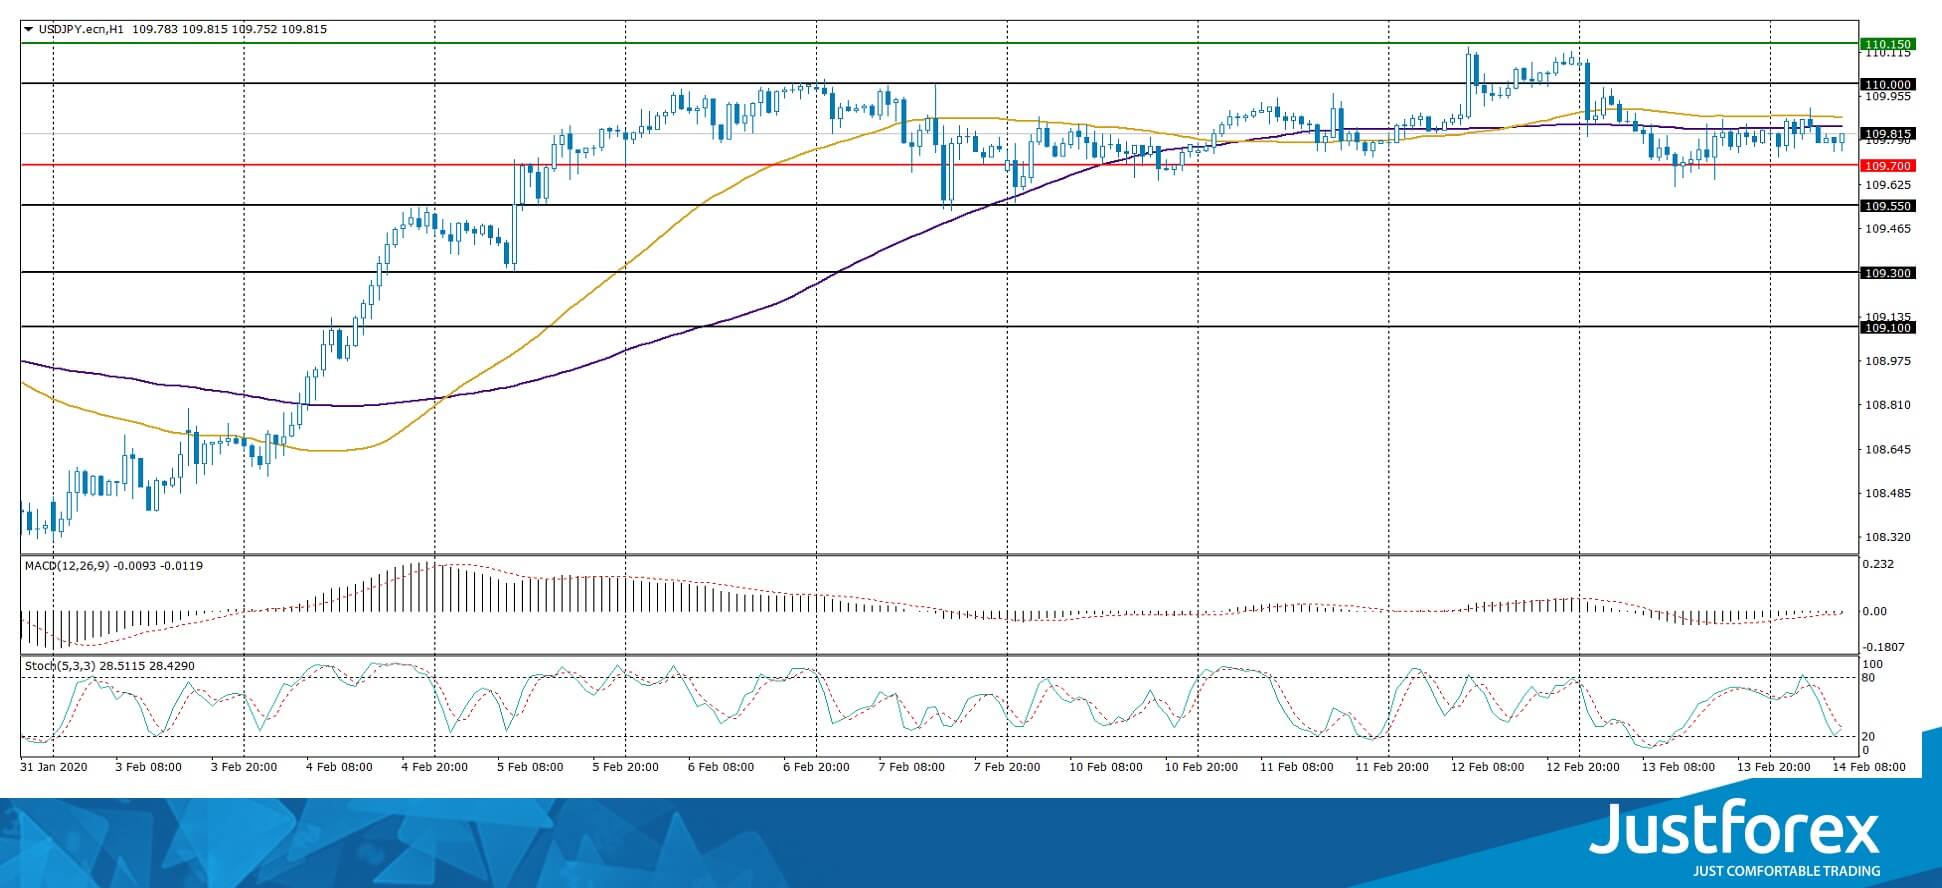
Indicators do not give an accurate signal: 50 MA crossed 100 MA.
MACD histogram is near the 0 mark. No signals at the moment.
The Stochastic Oscillator is located in the overbought area, the %K line is above the %D line, which gives a weak signal to buy USD/JPY.
Trading recommendations
Support levels: 109.600, 109.300, 109.100
Resistance levels: 109.900, 110.150
If the price fixes below 109.600, USD/JPY sales should be considered. Potential movement towards 109.300-109.100.
Alternatively, the quotes could grow of USD/JPY currency pair to 110.100-110.300.


