
The EUR/USD currency pair
Technical indicators of the currency pair:
Prev Open: 1.12607
Open: 1.11739
% chg. over the last day: -0.76
Day’s range: 1.11522 – 1.12212
52 wk range: 1.0879 – 1.1572
A bearish sentiment prevails on the EUR/USD currency pair. The trading instrument has updated the local lows. Yesterday ECB kept the base interest rate on loans at zero level, the rate on deposits at -0.5%. The regulator will increase the asset buyback program by 120 billion euro by the end of 2020. Investors continue to assess the risks of COVID-19 virus spread and its impact on the global economy. At present, EUR/USD quotes are consolidating in the range of 1.11550-1.12500. The EUR can decline further. Open positions from key levels.
The Economic News Feed for 13.03.2020:
US export and import price indices – 14:30 (GMT+2:00);
Consumer expectations and sentiment indices from the University of Michigan – 16:00 (GMT+2:00).
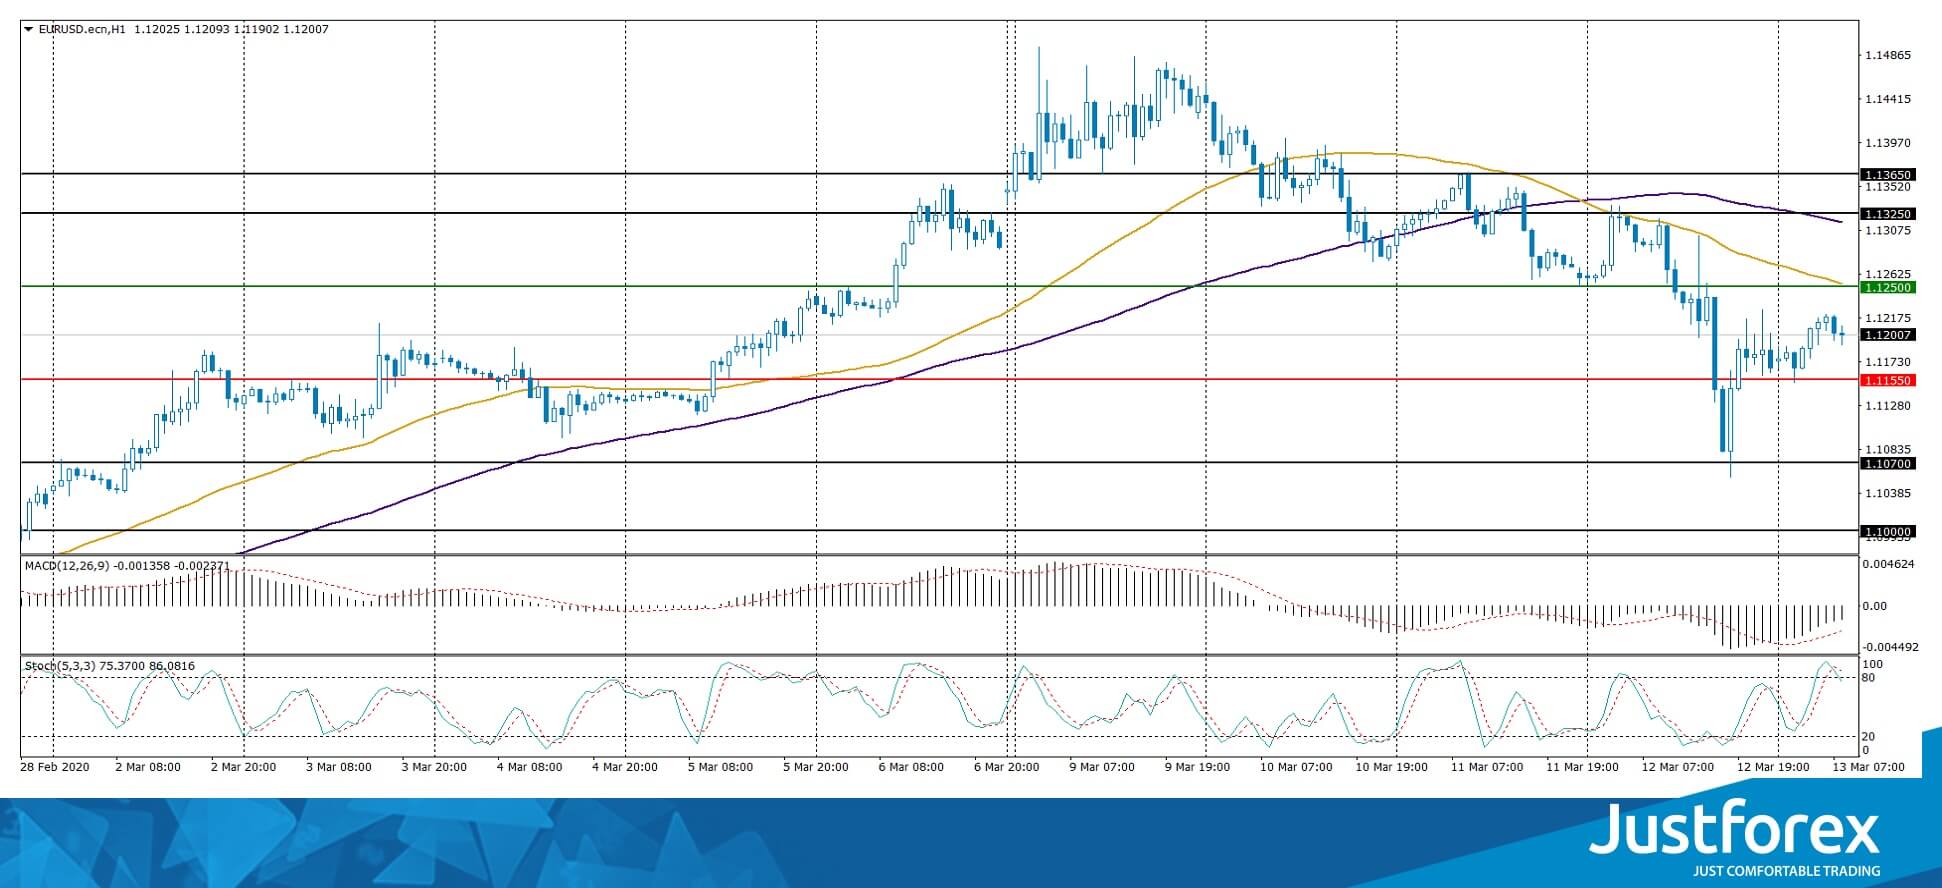
The indicators signal the sellers’ power: the price has fixed below 50 MA and 100 MA.
MACD histogram is in the negative zone, but above the signal line, which gives a weak signal to sell EUR/USD.
The Stochastic Oscillator is located in the overbought zone, the %K line crossed the %D line. There are no signals at the moment.
Trading recommendations
Support levels: 1.11550, 1.10700, 1.10000
Resistance levels: 1.12500, 1.13250, 1.13650
If the price fixes below 1.11550, expect further decline toward 1.11000-1.10500.
Alternatively, the quotes could grow toward 1.13000-1.13500.
The GBP/USD currency pair
Technical indicators of the currency pair:
Prev Open: 1.28194
Open: 1.25656
% chg. over the last day: -1.94
Day’s range: 1.25075 – 1.25839
52 wk range: 1.1959 – 1.3516
Aggressive selling is observed on GBP/USD currency pair. Since the beginning of this week the drop in quotes has exceeded 550 points. At the moment the sterling has stabilized. The local support and resistance levels are 1.25000 and 1.26300, respectively. The trading instrument has potential for further decline. We recommend opening positions from key levels.
The news background on the British economy is calm.
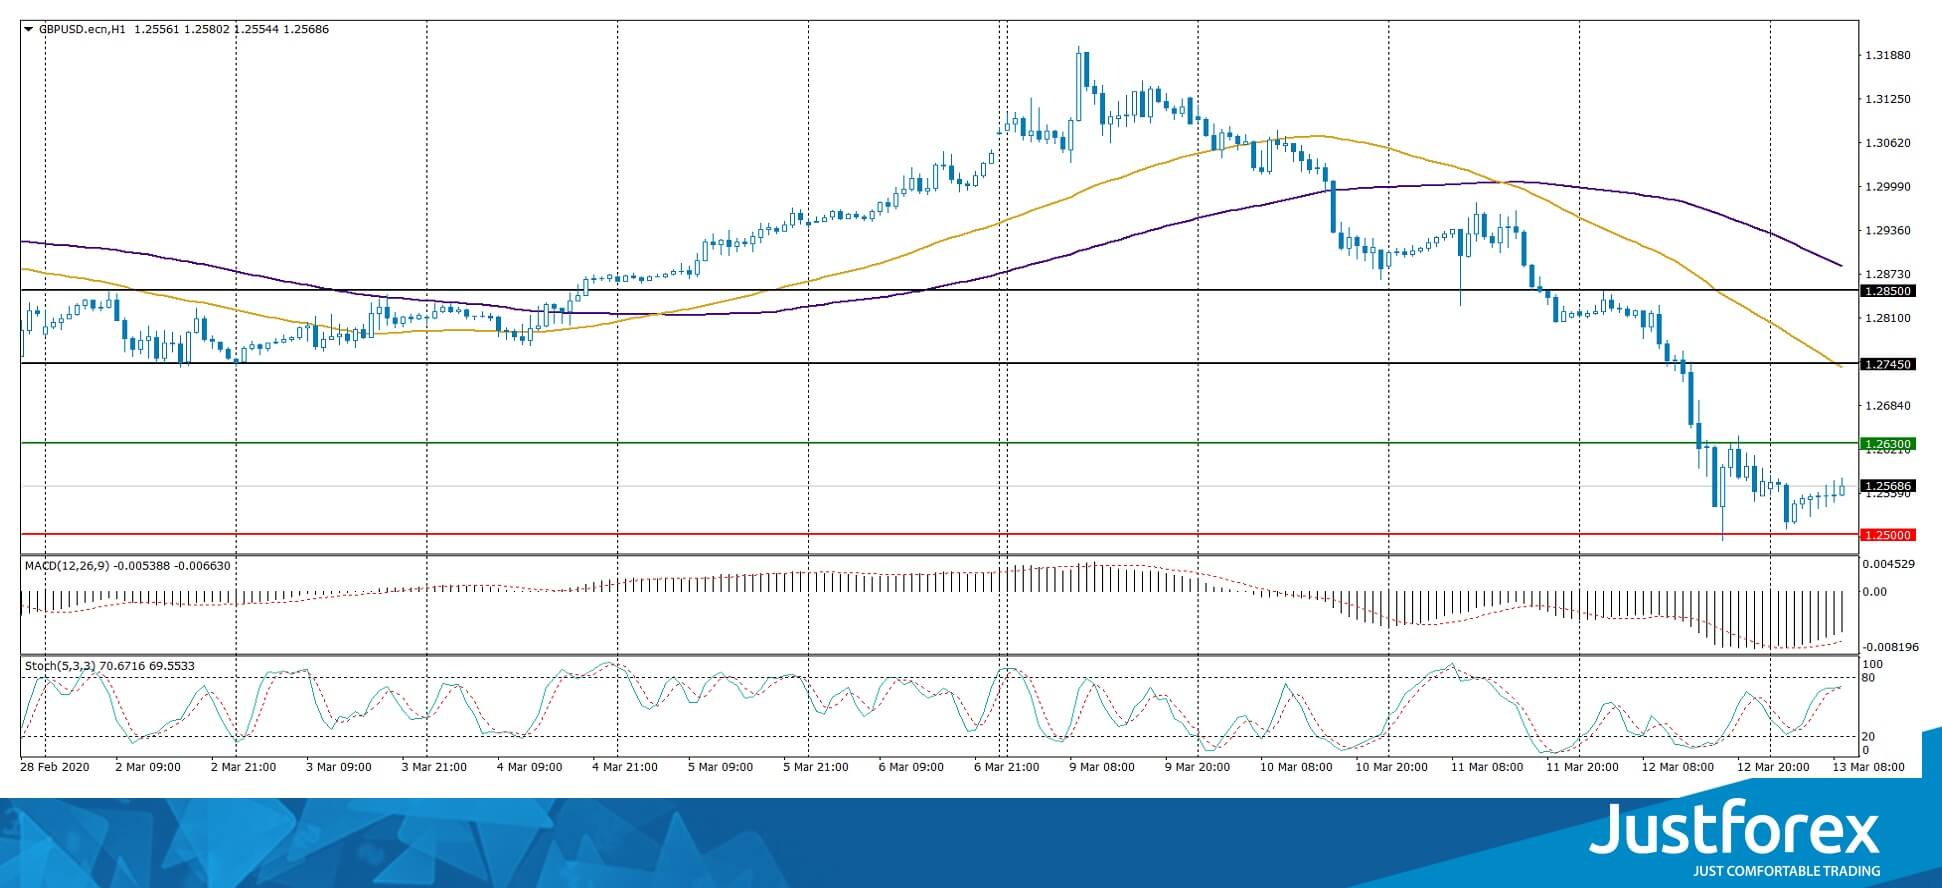
The indicators signal the sellers’ strength: the price has fixed below 50 MA and 100 MA.
The MACD histogram is in the negative zone, which indicates a bearish sentiment.
The Stochastic Oscillator is in the neutral zone, the %K line has crossed the %D line. There are no signals at the moment.
Trading recommendations
Support levels: 1.25000, 1.24000
Resistance levels: 1.26300, 1.27450, 1.28500
If the price fixes below the round level of 1.25000, expect a further decline toward 1.24000-1.23500.
Alternatively, the quotes could grow toward 1.27400-1.28000.
The USD/CAD currency pair
Technical indicators of the currency pair:
Prev Open: 1.37748
Open: 1.39172
% chg. over the last day: +0.05
Day’s range: 1.37748 – 1.39172
52 wk range: 1.2949 – 1.3566
USD/CAD currency pair has stabilized after a long rally. At the moment, the CAD is consolidating. Local support and resistance levels are at 1.38400 and 1.39500, respectively. Technical correction of the trading instrument is not ruled out in the nearest future. We recommend you to pay attention to the dynamics of oil prices. Open positions from key levels.
Publication of important economic releases from Canada is not planned.
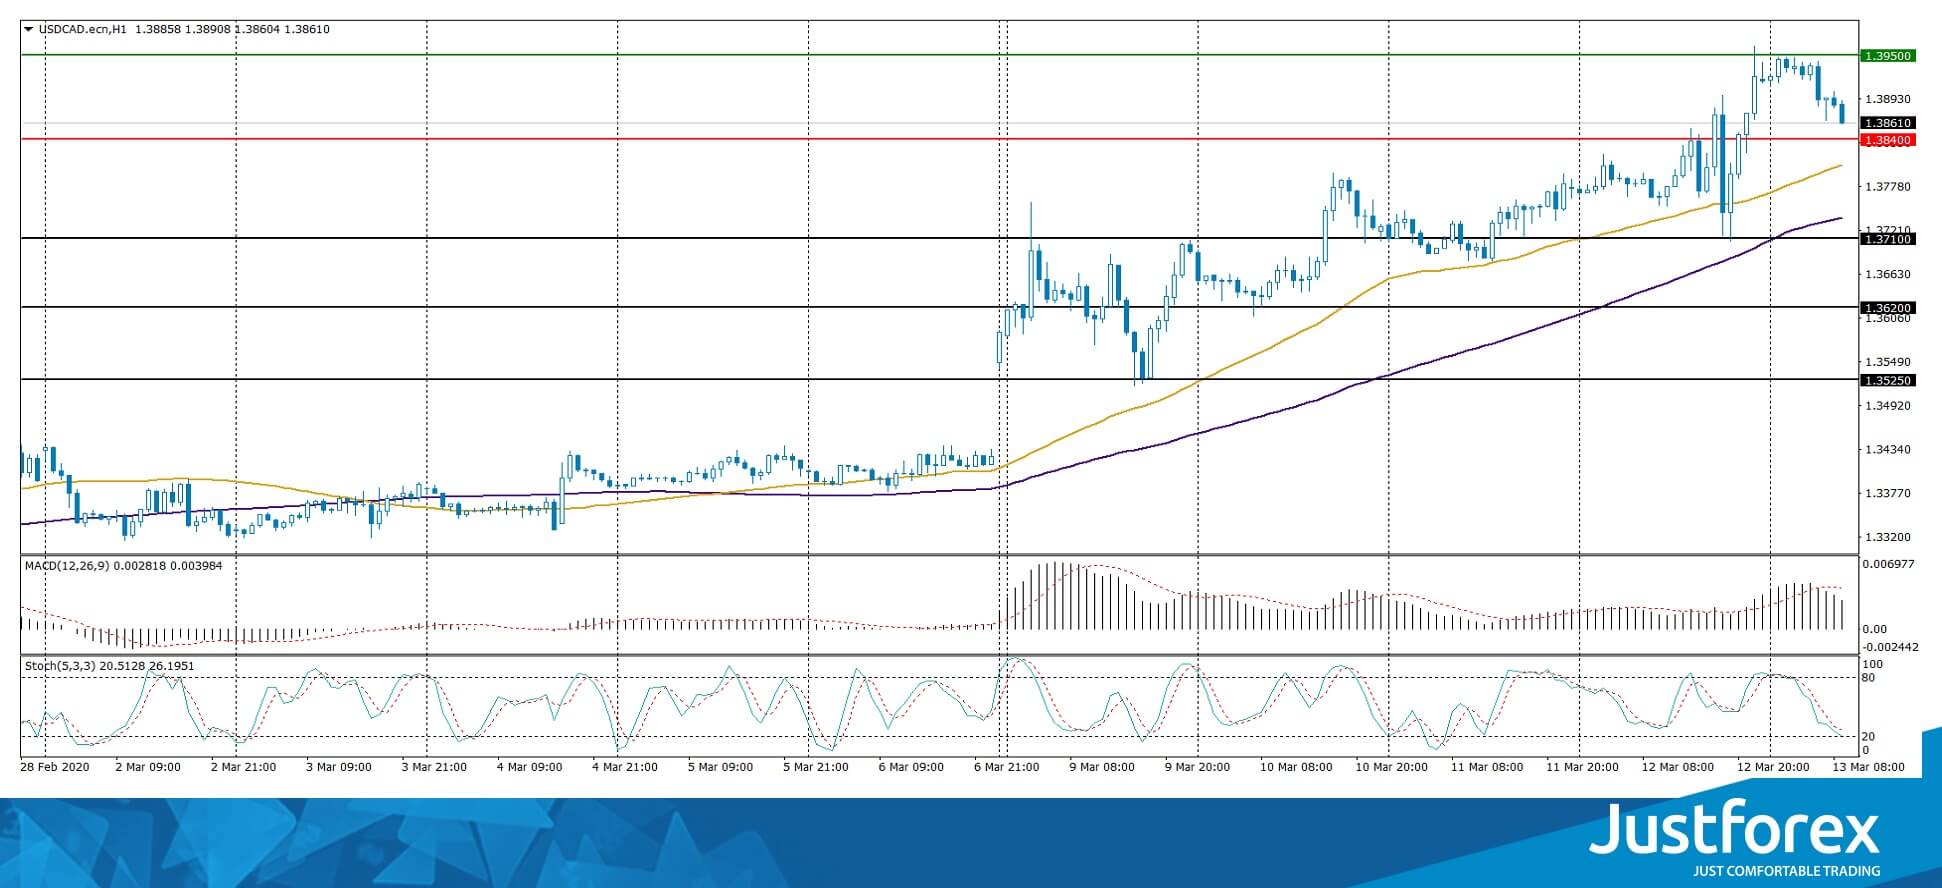
The indicators indicate the power of buyers: the price has fixed above 50 MA and 100 MA.
Histogram of MACD is in positive zone.
The Stochastic Oscillator is in the neutral zone, the %K line is below the %D line, which indicates a possible correction of the USD/CAD currency pair.
Trading recommendations
Support levels: 1.38400, 1.37100, 1.36200
Resistance levels: 1.39500, 1.40000
If the price fixes above 1.39500, expect a rise to 1.40000-1.40300.
Alternatively, the quotes could correct toward 1.37600-1.37000.
The USD/JPY currency pair
Technical indicators of the currency pair:
Prev Open: 104.423
Open: 104.733
% chg. over the last day: +0.21
Day’s range: 104.585 – 106.011
52 wk range: 101.19 – 112.41
The USD/JPY currency pair has an ambiguous technical pattern. The trading instrument is in a flat. At the moment the safe haven currency is testing the round level of 106.000. 104.500 is the nearest support. USD/JPY can still recover. We recommend you to pay attention to the dynamics of the US government bonds yield. Open positions from key levels.
During the Asian trading session, there was a weak release on business activity in the service sector.
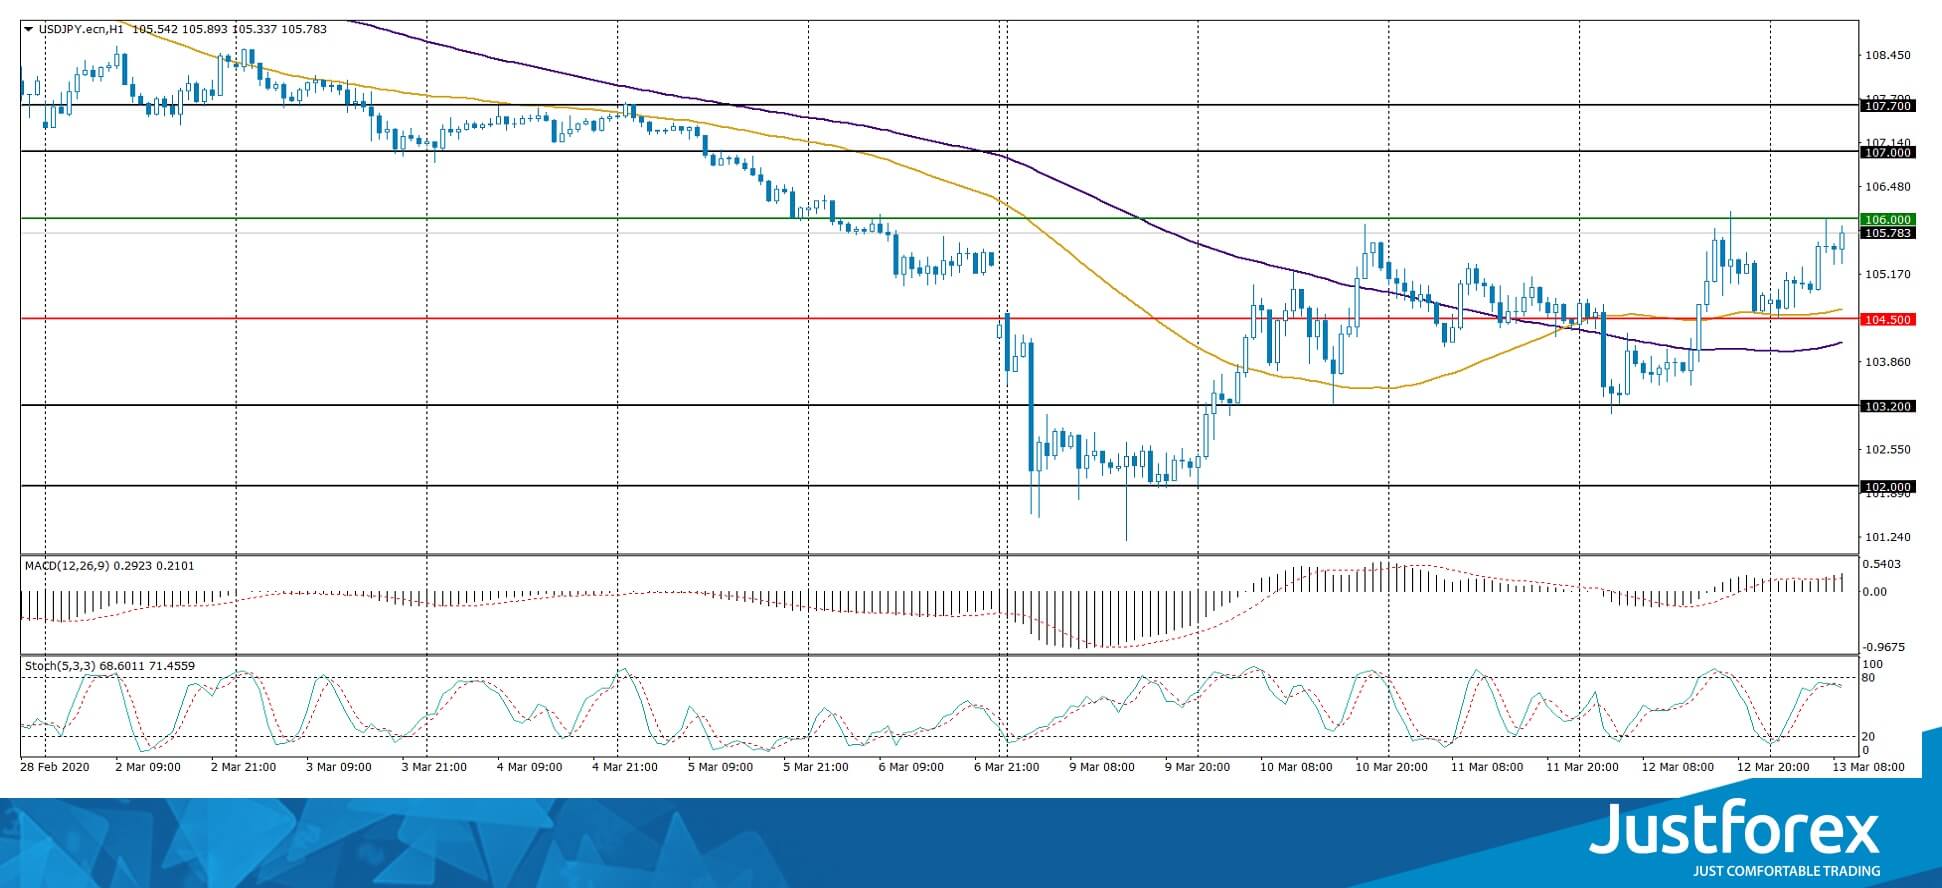
The indicators signal the power of buyers: the price has fixed above 100 MA.
The MACD histogram is in the positive zone, which indicates a correction of the USD/JPY currency pair.
The Stochastic Oscillator is in the neutral zone, the %K line crossed the %D line. There are no signals at the moment.
Trading recommendations
Support levels: 104.500, 103.200, 102.000
Resistance levels: 106.000, 107.000, 107.700
If the price fixes above 106.000, expect the quotes to grow toward 107.000-107.700.
Alternatively, the quotes could descend toward 103.500-103.000.


