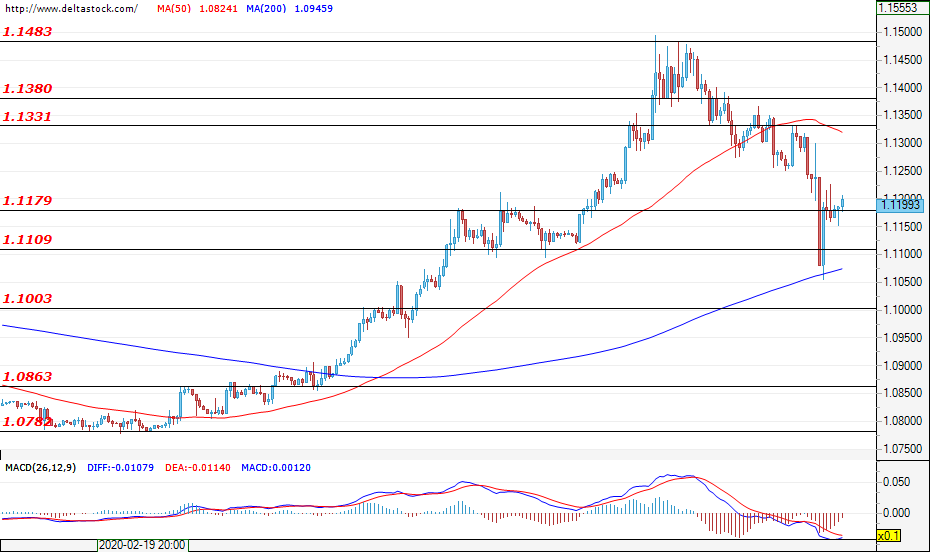
EUR/USD
Current level – 1.1199
With the appreciation of the euro since the beginning of the week, it was logical to see a correction which led the trading around 1.1100 levels. At the time of writing the analysis, the currency pair is trading at levels just above the resistance at 1.1180, as a breakthrough would bring the movement to a test of the next resistance at 1.1330, followed by 1.1380. In a downward direction, only a breakthrough of the main support at 1.1110 would mean deepening the bearish sentiment and carry the trade to levels around 1.1000. There is no economic news during the last day of the week that would have an impact on the currency pair’s trading, but extraordinary central bank decisions are likely to have an impact.
| Resistance | Support | ||
| intraday | intraweek | intraday | intraweek |
| 1.1330 | 1.1480 | 1.1100 | 1.0860 |
| 1.1380 | 1.1580 | 1.1000 | 1.0780 |
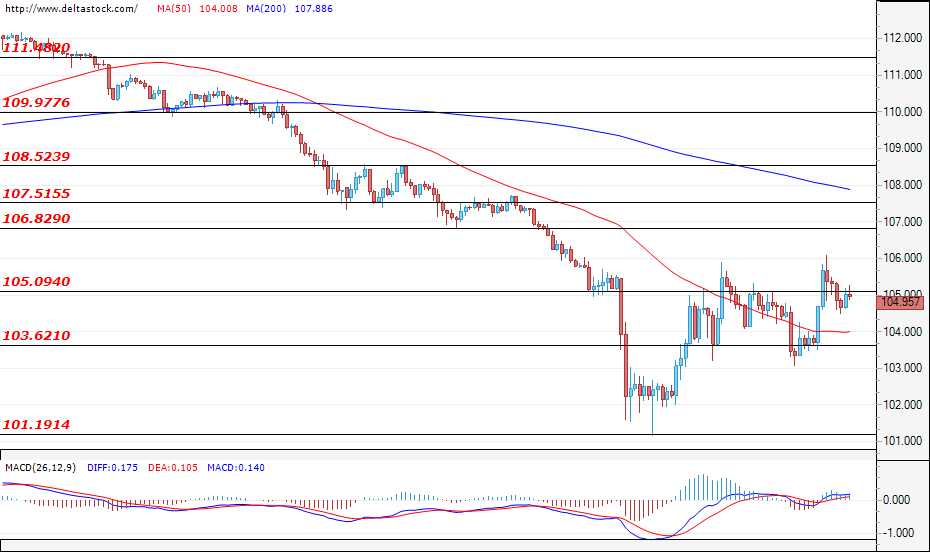
USD/JPY
Current level – 104.95
The attempt in downward direction for break of the support at 103.60 was unsuccessful, with the currency pair currently facing a test of the resistance at 105.10. Successful break at this level would restore the bullish sentiment and it is possible to observe a rise and a test of the next resistance at 106.80. The main support in downward direction is the 101.20 level.
| Resistance | Support | ||
| intraday | intraweek | intraday | intraweek |
| 105.10 | 108.50 | 103.60 | 101.20 |
| 106.80 | 110.00 | 102.00 | 97.80 |
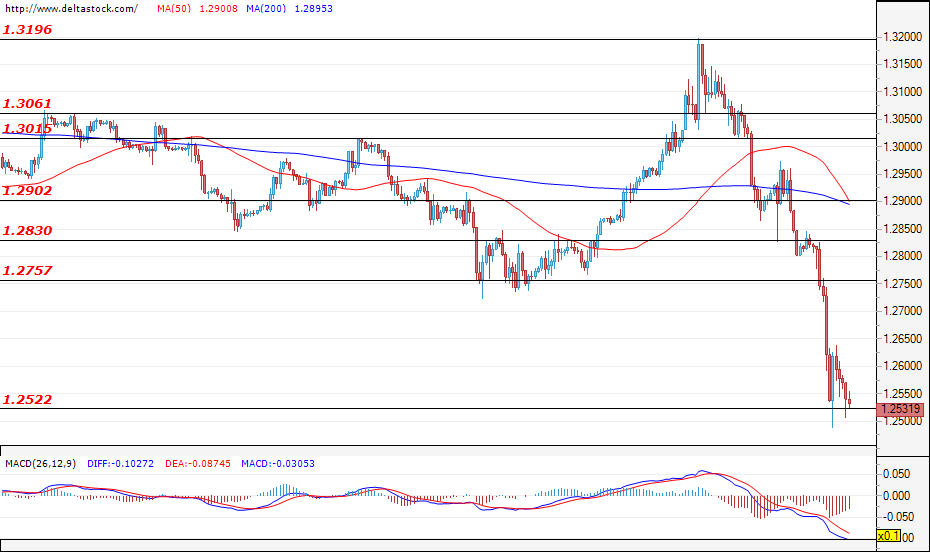
GBP/USD
Current level – 1.2531
After the emergency rate cut by the CBOE, which contributed for the serious sell off of the currency pair, we witnessed a breakthrough of the support zone at 1.2757, and at the time of writing the analysis, the price movement is facing a test of the next support at 1.2520. A breakthrough at this level would increase the bearish sentiment even more and it is possible to reduce the price to 1.2390 and then to 1.2200. To reverse the negative trend regarding the large time frames, we can consider as a signal only a break of the distant level at 1.3300.
| Resistance | Support | ||
| intraday | intraweek | intraday | intraweek |
| 1.2760 | 1.2900 | 1.2520 | 1.2200 |
| 1.2830 | 1.3015 | 1.2390 | 1.2200 |