
The EUR/USD currency pair
Technical indicators of the currency pair:
Prev Open: 1.10831
Open: 1.11783
% chg. over the last day: +0.47
Day’s range: 1.11021 – 1.11981
52 wk range: 1.0879 – 1.1572
The EUR/USD currency pair is in sideways movement. There is no defined trend. Investors continue to assess the risks of further spread of the COVID-19 virus and its impact on the global economy. On Monday, the U.S. Presidential Administration urged the Senate to urgently support the Coronavirus Bill approved by the House of Representatives. Earlier, the U.S. Federal Reserve has urgently reduced the key interest rate range to 0-0.25%. At the moment the key levels of support and resistance are at 1.10700 and 1.11850, respectively. The trading instrument can descend further. Open positions from key levels.
The Economic News Feed for 17.03.2020:
ZEW Economic Sentiment Index in Germany – 12:00 (GMT+2:00);
US retail sales – 14:30 (GMT+2:00);
Job Openings and Labor Turnover Survey (JOLTS) – 16:00 (GMT+2:00).
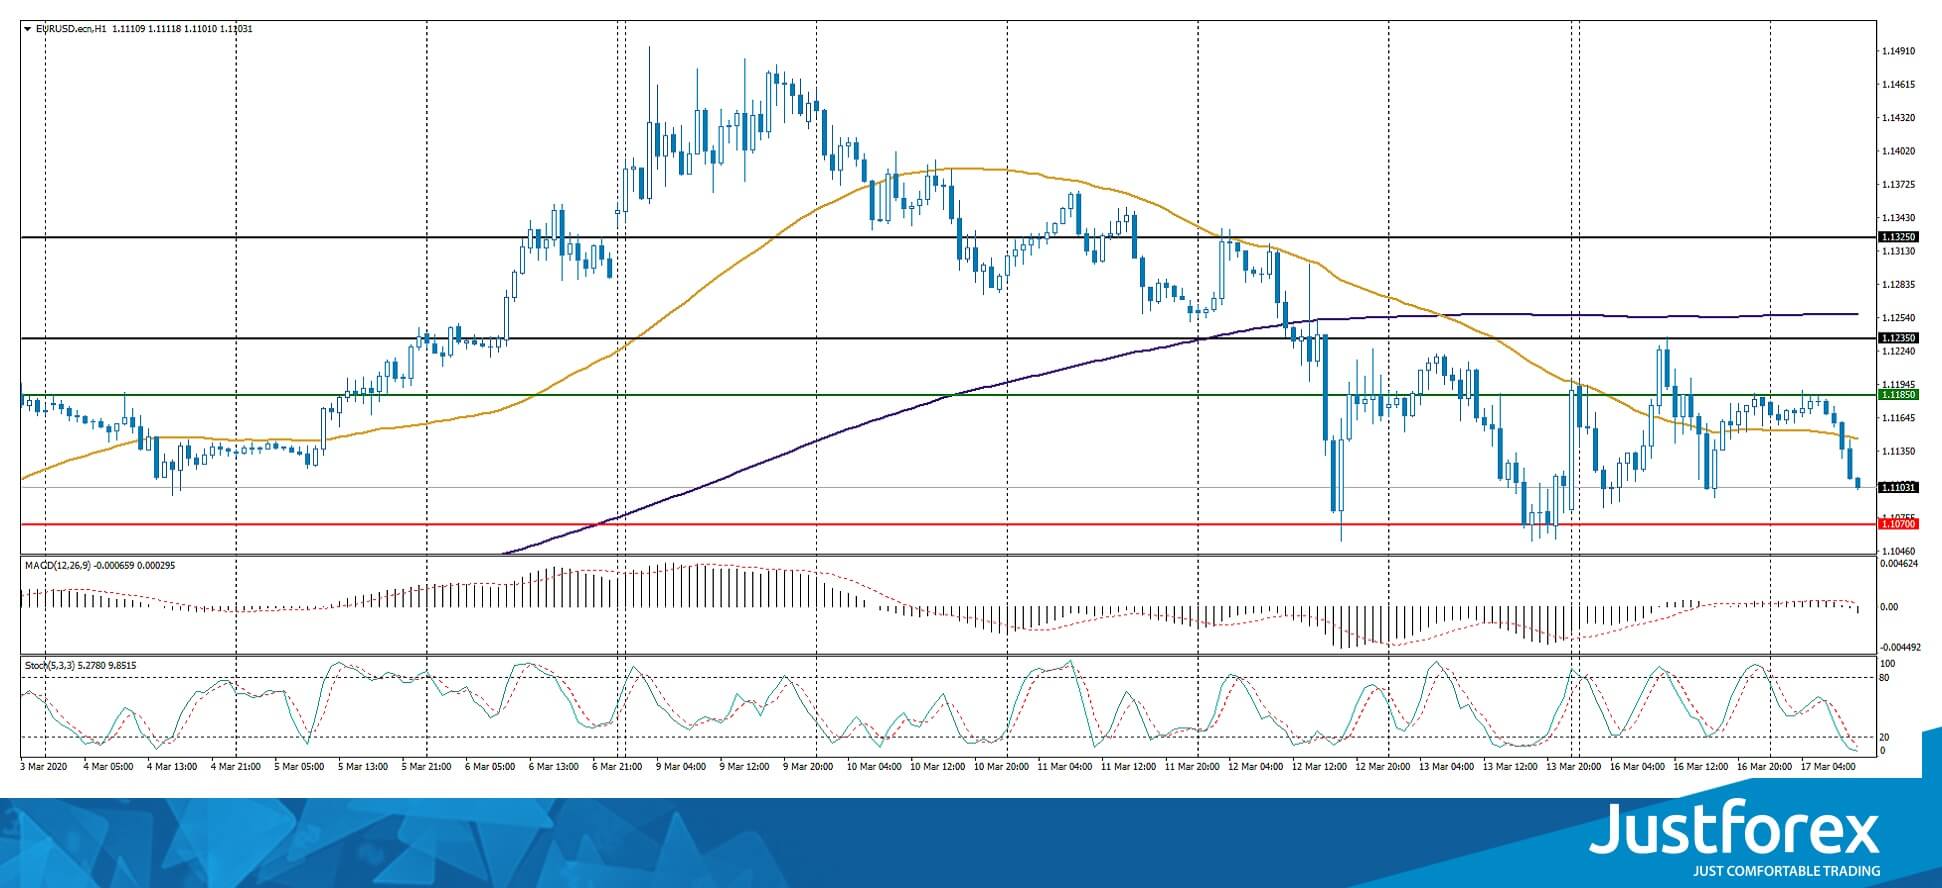
Indicators do not give accurate signals: the price has crossed 50 MA.
MACD histogram is near the 0 mark.
The Stochastic Oscillator is located in the oversold area, the %K line is below the %D line, which gives a weak sell signal for EUR/USD.
Trading recommendations
Support levels: 1.10700, 1.10000
Resistance levels: 1.11850, 1.12350, 1.13250
If the price fixes below 1.10700, expect the quotes to fall toward 1.10000.
Alternatively, the quotes could grow toward 1.12500-1.13000.
The GBP/USD currency pair
Technical indicators of the currency pair:
Prev Open: 1.24085
Open: 1.25688
% chg. over the last day: -1.06
Day’s range: 1.21747 – 1.22723
52 wk range: 1.1959 – 1.3516
The GBP/USD currency pair still shows a steady downtrend. The pound has renewed the key lows. At the moment, GBP/USD is testing the level of 1.21750. The round level 1.23000 is the nearest resistance. The trading instrument has potential for further decline. We recommend you to keep track of the current information about the COVID-19 virus spread. Open positions from key levels.
At 11:30 (GMT+2:00) the UK labor market report will be published.
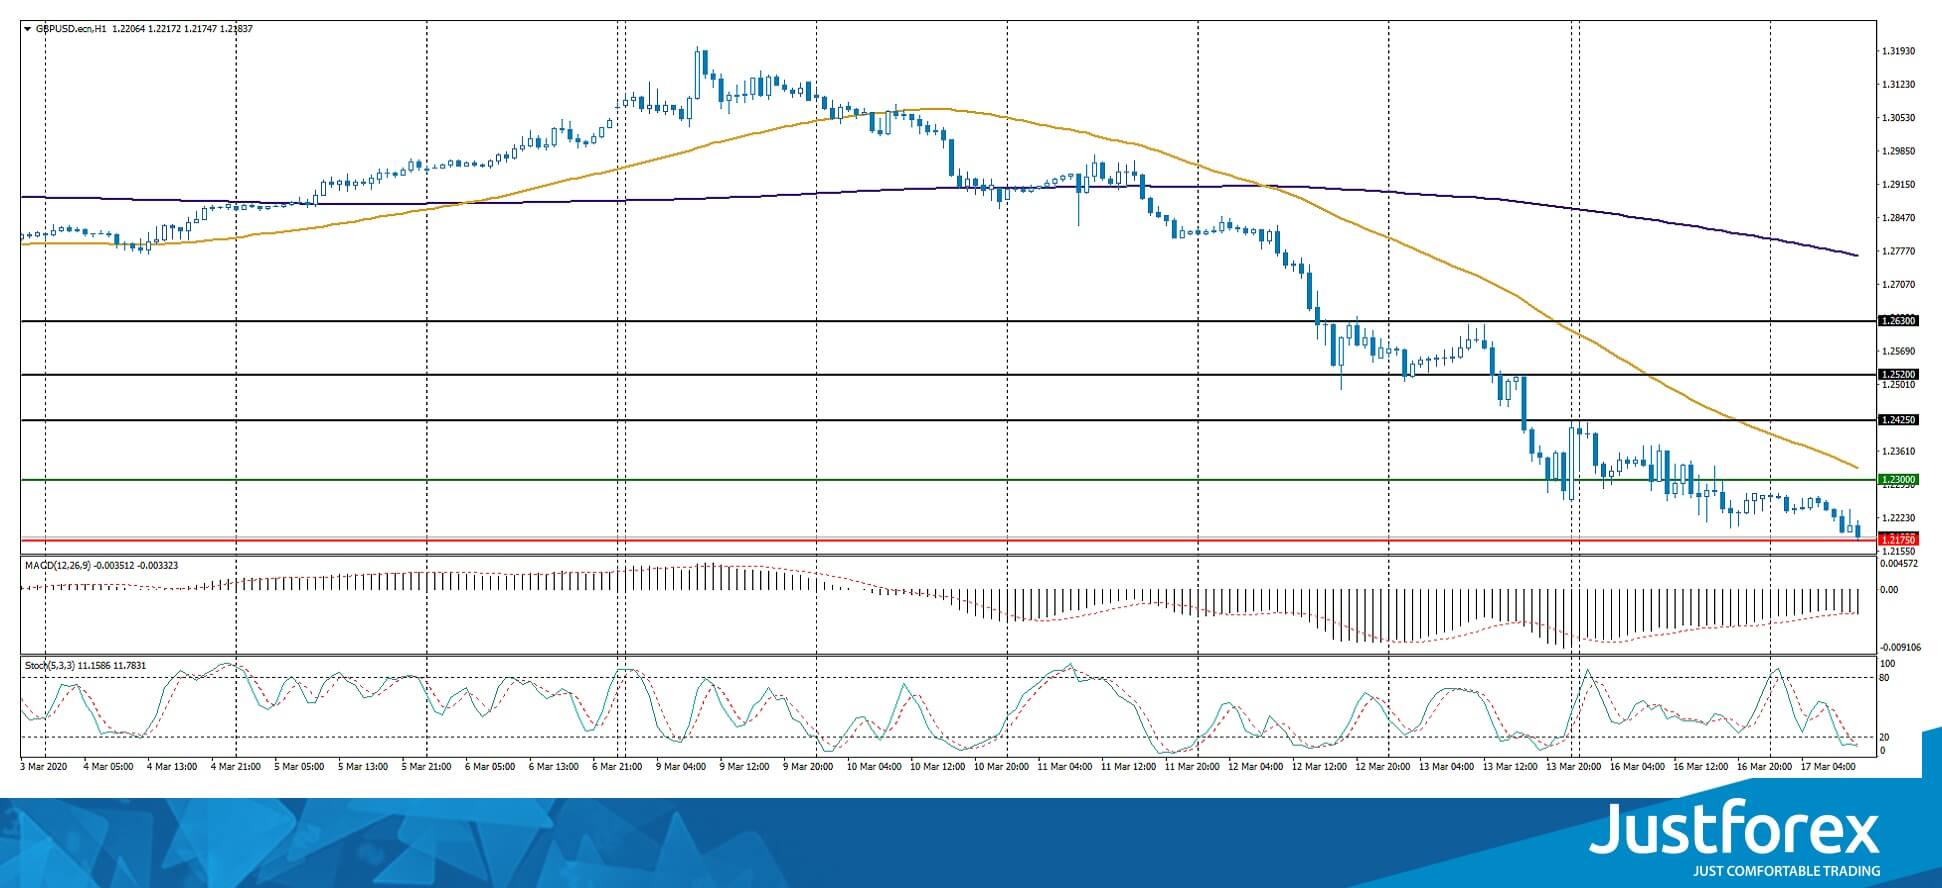
The indicators signal the sellers’ power: the price has fixed below 50 MA and 100 MA.
The MACD histogram is in the negative zone, which indicates a bearish sentiment.
The Stochastic Oscillator is located in the oversold area, the %K line crossed the %D line. There are no signals at the moment.
Trading recommendations
Support levels: 1.21750, 1.21000
Resistance levels: 1.23000, 1.24250, 1.25200
If the price fixes below 1.21750, expect the quotes to fall toward 1.21000.
Alternatively, the quotes could correct toward 1.24000-1.25000.
The USD/CAD currency pair
Technical indicators of the currency pair:
Prev Open: 1.37394
Open: 1.40007
% chg. over the last day: +1.60
Day’s range: 1.39607 – 1.40787
52 wk range: 1.2949 – 1.4079
USD/CAD quotes moved up again after a long consolidation. The trading instrument has updated its multi-year highs. The CAD remains under pressure amid the negative dynamics of black gold prices. At the moment local support and resistance levels are at 1.39600 and 1.40750, respectively. The trading instrument can grow further. Open positions from key levels.
The publication of important economic releases from Canada is not planned.
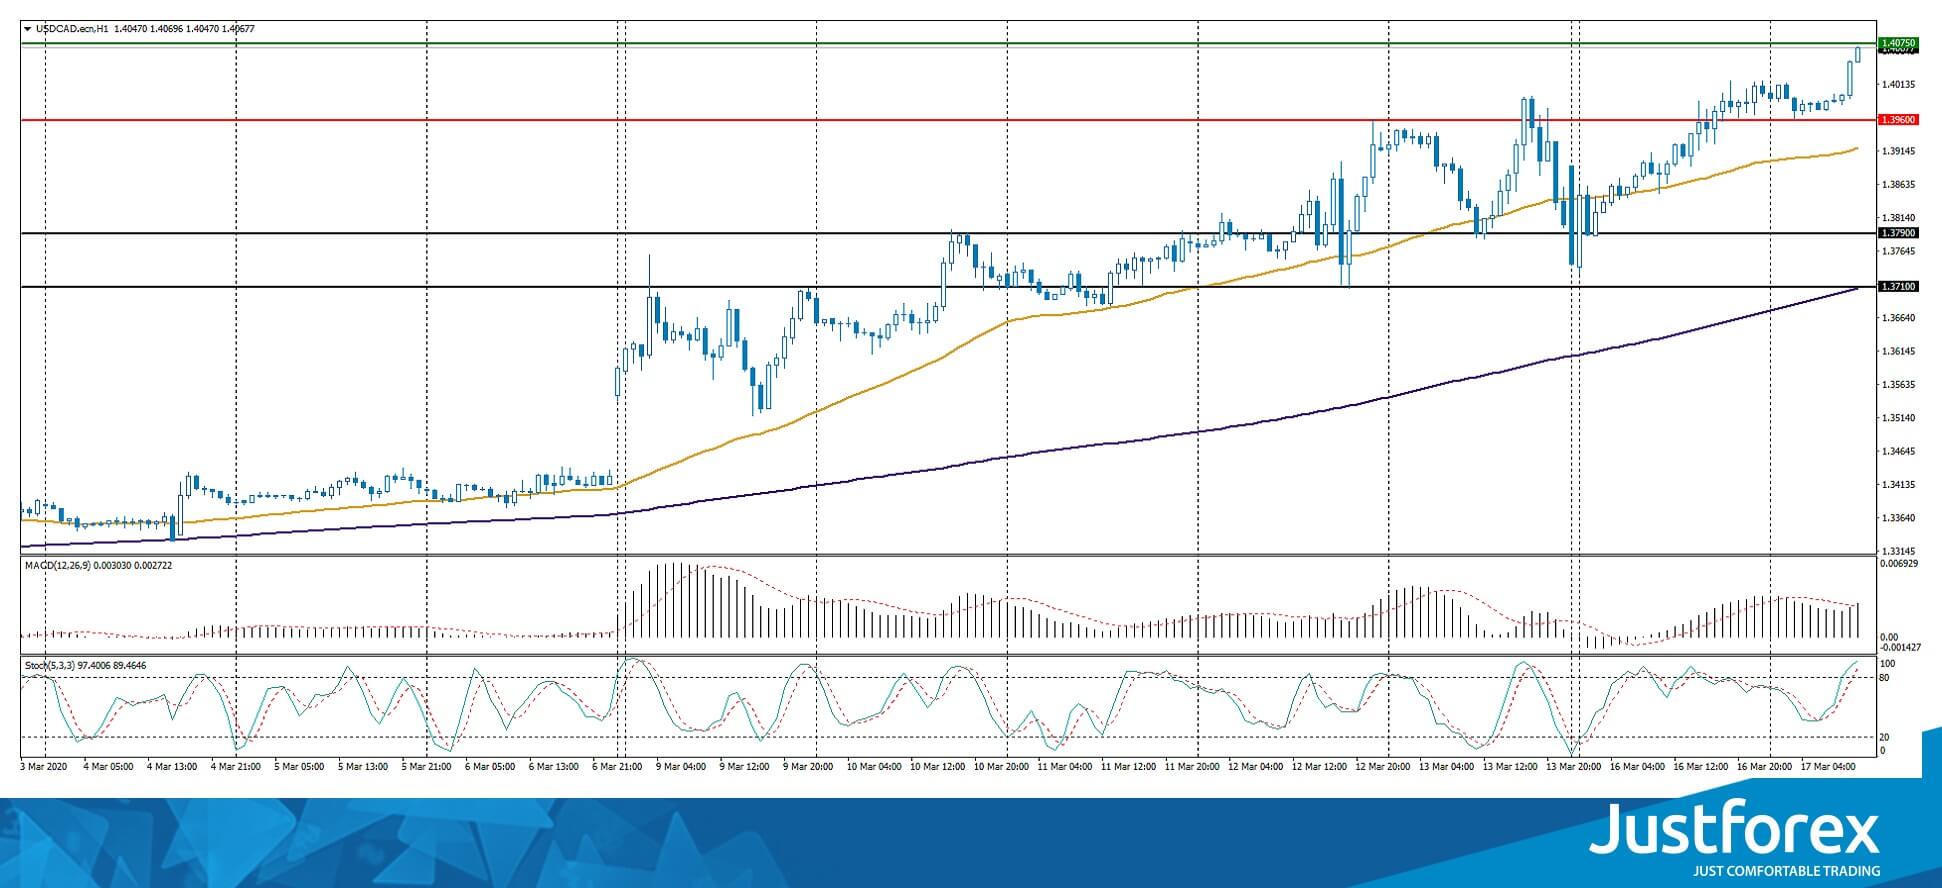
The indicators signal the power of buyers: the price has fixed above 50 MA and 100 MA.
MACD histogram is in the positive zone, which indicates a bullish sentiment.
The Stochastic Oscillator is located near the overbought zone, the %K line is above the %D line, which gives a weak signal to buy USD/CAD.
Trading recommendations
Support levels: 1.39600, 1.37900, 1.37100
Resistance levels: 1.40750, 1.41500
If the price fixes above 1.40750, expect the quotes to grow toward 1.41500-1.42000.
Alternatively, the quotes could correct toward 1.38700-1.38200.
The USD/JPY currency pair
Technical indicators of the currency pair:
Prev Open: 107.304
Open: 105.877
% chg. over the last day: -1.33
Day’s range: 105.866 – 107.188
52 wk range: 101.19 – 112.41
The USD/JPY currency pair has an ambiguous technical pattern. The trading instrument is in sideways movement. There is no defined trend. USD/JPY quotes are testing local support and resistance levels at 105.700 and 107.000, respectively. Investors are waiting for additional drivers. Today we recommend you to pay attention to economic reports from the USA and open positions from key levels.
The Economic News Feed for 17.03.2020 is calm.
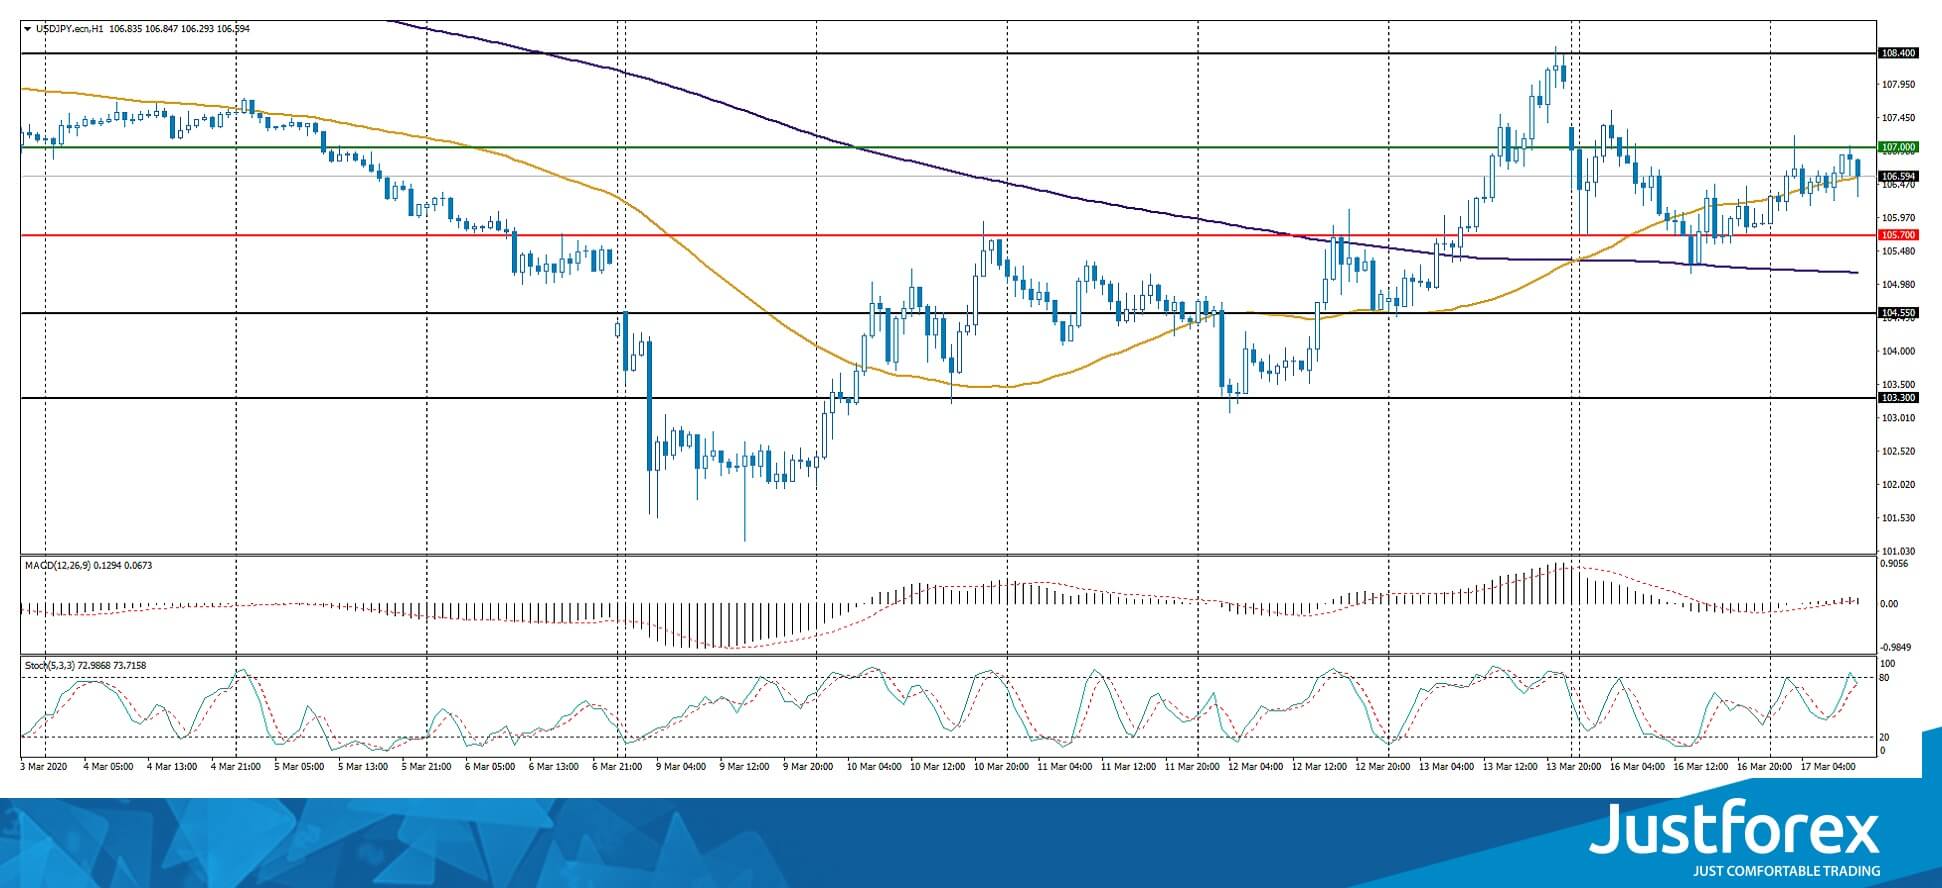
Indicators do not give accurate signals: the price has crossed 50 MA.
MACD histogram is near the 0 mark.
The Stochastic Oscillator is located in the neutral zone, the %K line has crossed the %D line. There are no signals at the moment.
Trading recommendations
Support levels: 105.700, 104.550, 103.300.
Resistance levels: 107.000, 108.400
If the price fixes above 107.000, expect the quotes to rise toward 108.200-109.000.
Alternatively, the quotes could descend toward 105.000-104.000.


