The New Zealand Dollar has declined significantly against the US Dollar since March 10. The currency pair has declined by 614 pips or 7.07% in value during the past three weeks.
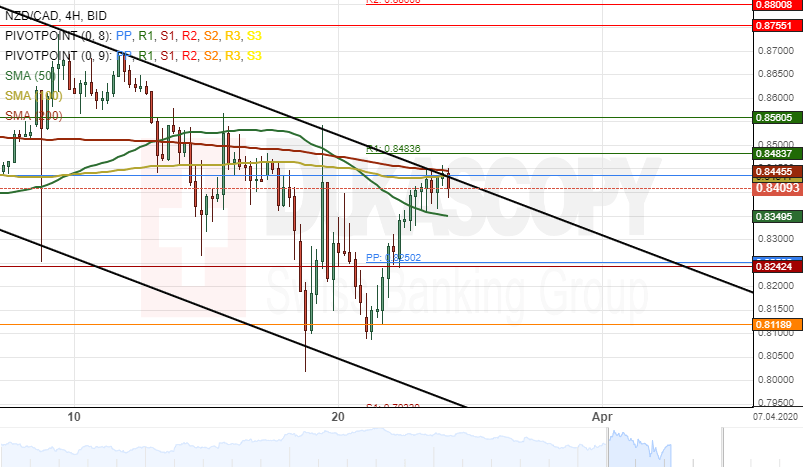
Currently, the exchange rate is trading near a resistance cluster formed by the 100– and 200— hour SMAs and the upper boundary of a descending channel at 0.8447.
If the resistance cluster holds, the NZD/CAD pair could continue to decline in the descending channel pattern within this week’s trading sessions.
However, technical indicators suggest that the currency exchange rate will most likely make a slight upside movement within the following trading sessions.