
The EUR/USD currency pair
Technical indicators of the currency pair:
Prev Open: 1.11161
Open: 1.10430
% chg. over the last day: -0.80
Day’s range: 1.09847 – 1.10527
52 wk range: 1.0777 – 1.1494
The EUR / USD currency pair stabilized after a significant rally last week. Quotes are currently being consolidated. The local support and resistance levels are 1.09750 and 1.10550, respectively. Investors continue to evaluate the impact of the coronavirus pandemic on the global economy. In the near future, technical correction of the trading instrument is not ruled out. We expect important reports today.
The Economic News Feed for 31.03.2020:
Labour Market Report (GER) – 10:55 (GMT+3:00);
Consumer Price Index (EU) – 12:00 (GMT+3:00);
Consumer Confidence Index (US) – 17:00 (GMT+3:00);
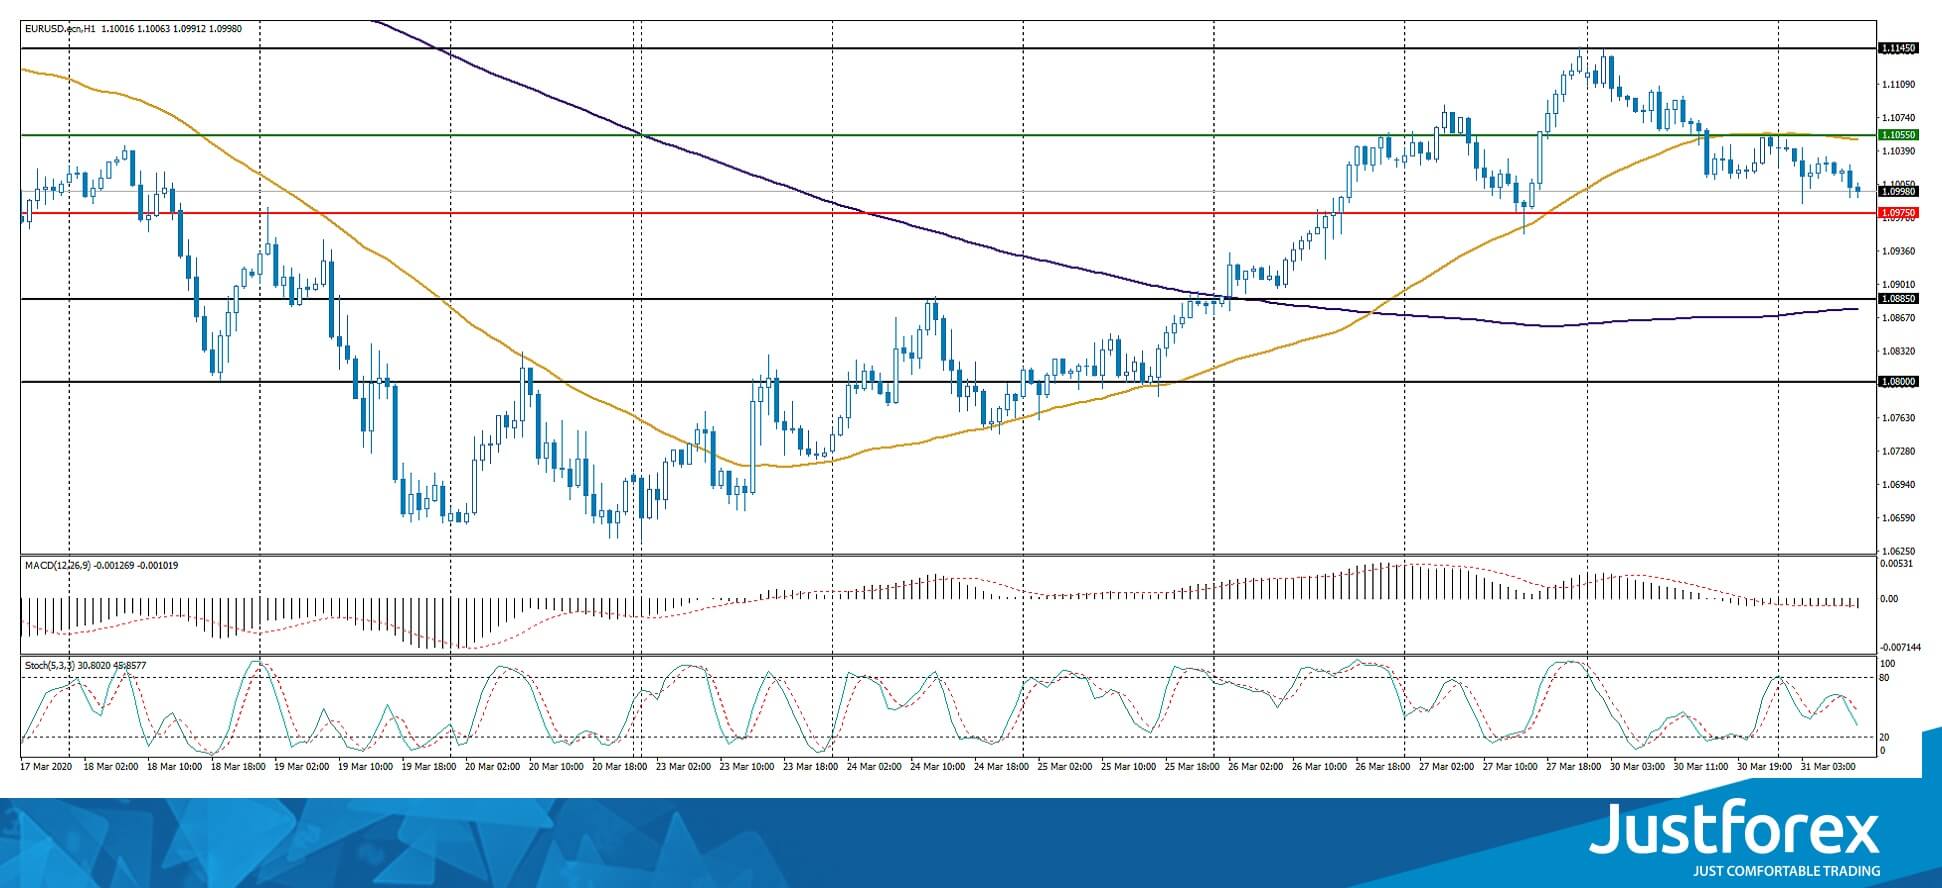
Indicators do not give accurate signals: the price has fixed between 50 MA and 100 MA.
The MACD histogram has moved into the negative zone, which indicates a possible correction of the EUR/USD currency pair.
The Stochastic Oscillator is in the neutral zone, the %K line is below the %D line, which indicates a bearish sentiment.
Trading recommendations
Support levels: 1.09750, 1.08850, 1.08000
Resistance levels: 1.10550, 1.11450
If the price consolidates below 1.09750, expec the quotes to correct toward 1.09000.
Alternatively, they can rise toward 1.11200-1.11500.
The GBP/USD currency pair
Technical indicators of the currency pair:
Prev Open: 1.24262
Open: 1.23978
% chg. over the last day: -0.27
Day’s range: 1.22421 – 1.24051
52 wk range: 1.1466 – 1.3516
An ambiguous technical picture has developed on the GBPUSD currency pair. Sterling is currently consolidating. GBP/USD quotes are testing a round level of 1.23000. The 1.24800 mark is a key resistance. Participants in financial markets expect additional drivers. In the near future, technical correction of the trading instrument is not ruled out. Open positions from key levels.
In the fourth quarter of 2019, UK GDP growth met market expectations and amounted to 1.1% (yoy).
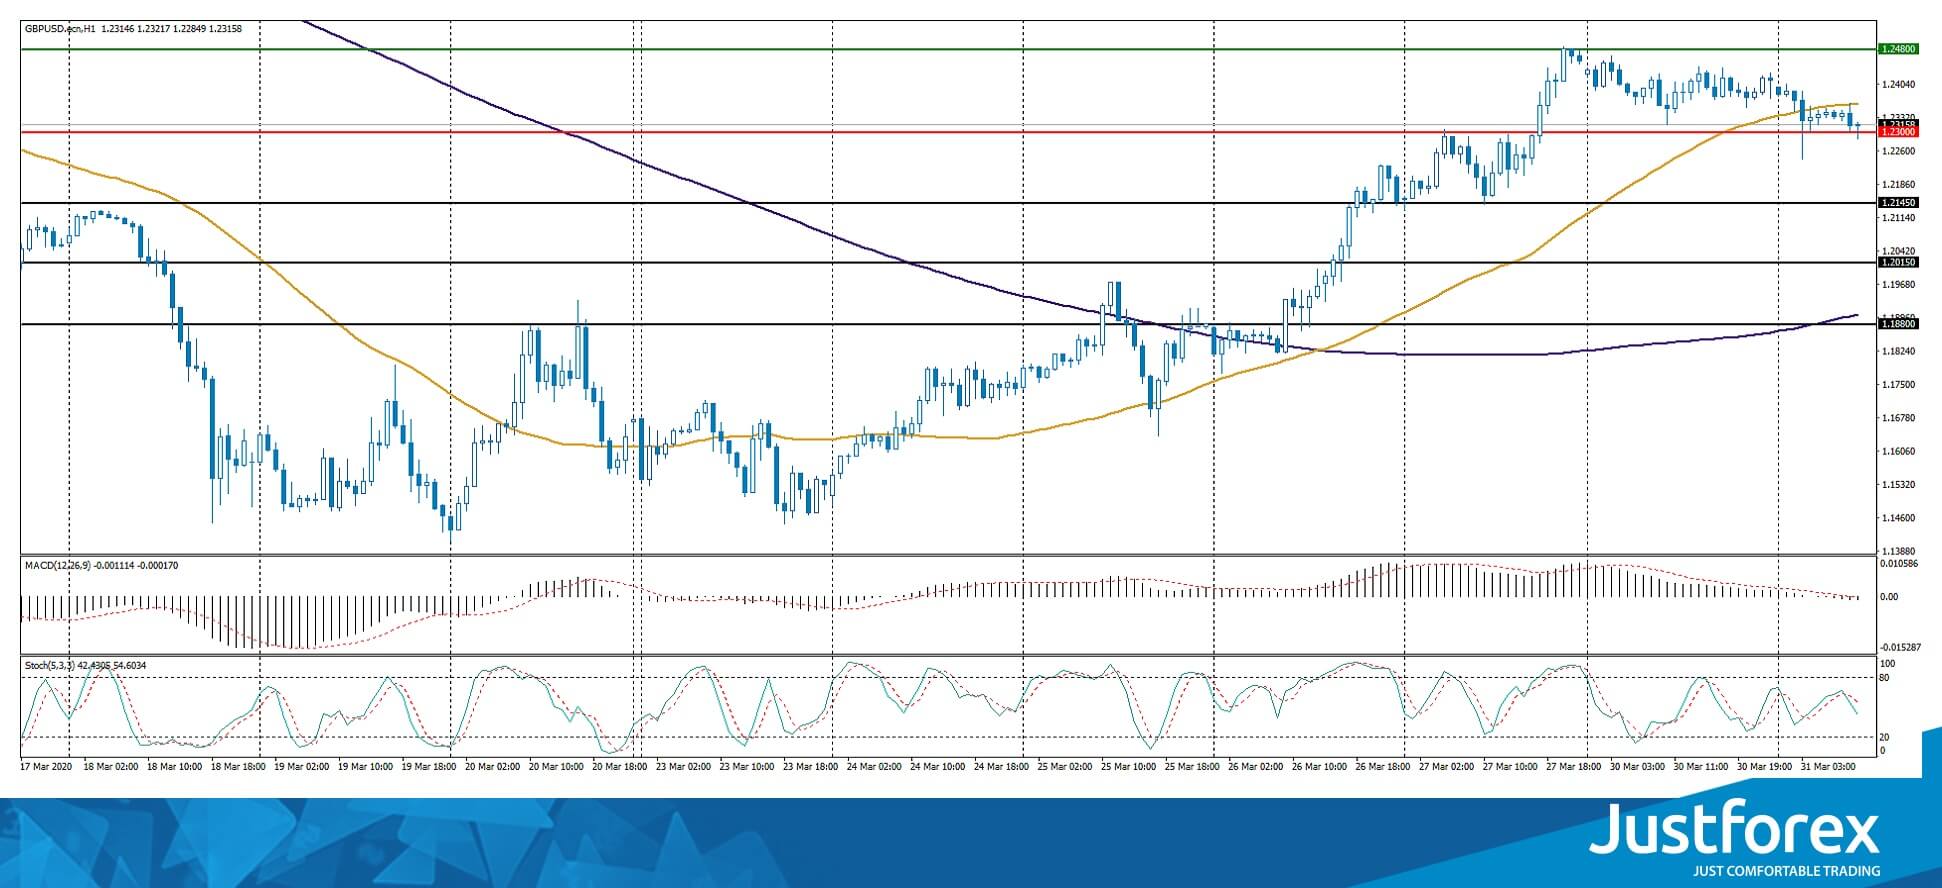
Indicators do not give accurate signals: the price crossed 50 MA.
The MACD histogram is near the 0 mark.
The Stochastic Oscillator is in the neutral zone, the %K line is below the %D line, which indicates a bearish sentiment.
Trading recommendations
Support levels: 1.23000, 1.21450, 1.20150
Resistance levels: 1.24800, 1.25500
If the price consolidates below the round level of 1.23000 expect a fall to 1.22000-1.21000.
Alternatively, the quotes could grow toward 1.25500-1.26000.
The USD/CAD currency pair
Technical indicators of the currency pair:
Prev Open: 1.40170
Open: 1.41624
% chg. over the last day: +0.87
Day’s range: 1.41496 – 1.42079
52 wk range: 1.2949 – 1.4668
The USD / CAD currency pair has moved up. The trading tool has updated local highs. Pressure on CAD is caused by a significant collapse in the oil prices yesterday. At the moment, USD/CAD quotes are testing a round level of 1.42000. 1.41000 is already a mirror support. We do not exclude further growth of the USD/CAD currency pair. Open positions from key levels.
At 15:30 (GMT+3:00), Canada will release a GDP report.
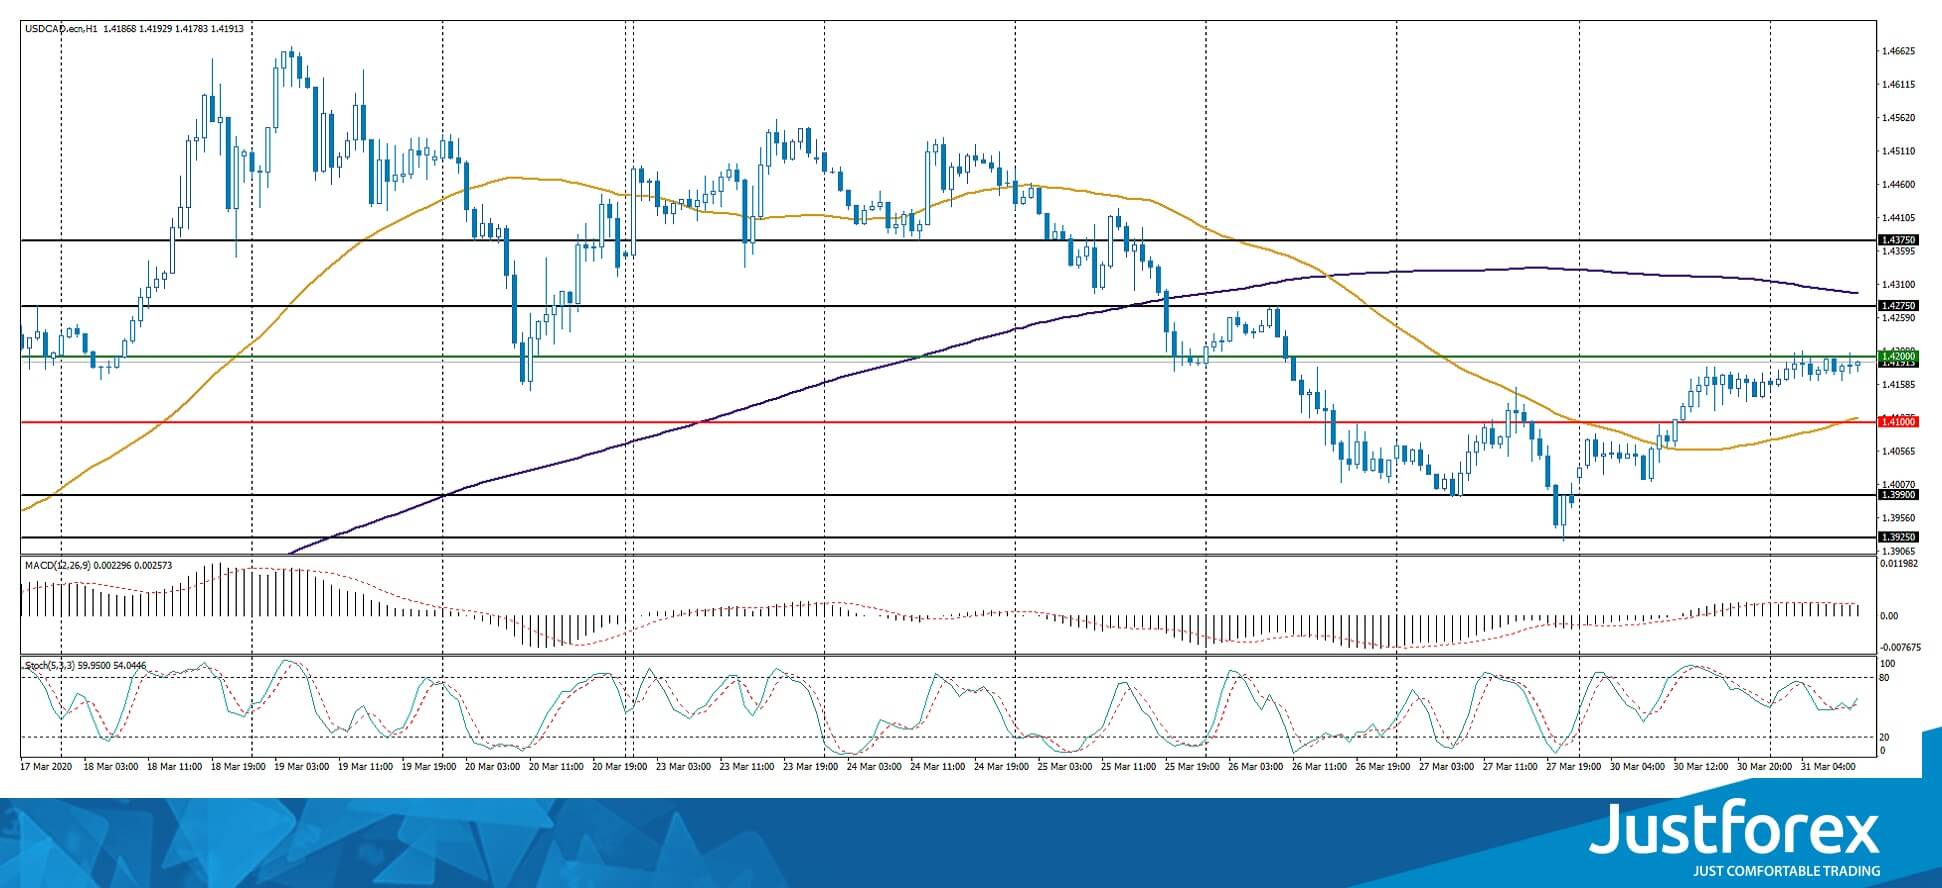
Indicators do not give accurate signals, the price fixed between 50 MA and 200 MA.
The MACD histogram is in the positive zone, which indicates an increase in the USD/CAD quotes.
The Stochastic Oscillator is in the neutral zone, the %K line crossed the %D line. There are no signals at the moment.
Trading recommendations
Support levels: 1.41000, 1.39900, 1.39250
Resistance levels: 1.42000, 1.42750, 1.43750
If the price consolidates above 1.42000, expect a rise to 1.42750-1.43500.
Alternatively, the quotes could descend toward 1.40500-1.39500.
The USD/JPY currency pair
Technical indicators of the currency pair:
Prev Open: 107.644
Open: 107.694
% chg. over the last day: +0.03
Day’s range: 107.692 – 108.714
52 wk range: 101.19 – 112.41
USD/JPY quotes stabilized after a significant drop. At the moment, the trading instrument is in lateral movement. There is no defined trend. The local support and resistance levels are: 107.800 and 108.600, respectively. Demand for the currency of the safe haven is still at a high level. We do not exclude the further strengthening of the yen against the greenback. Open positions from key levels.
Positive reports on industrial production and retail sales in Japan were published during the Asian trading session.
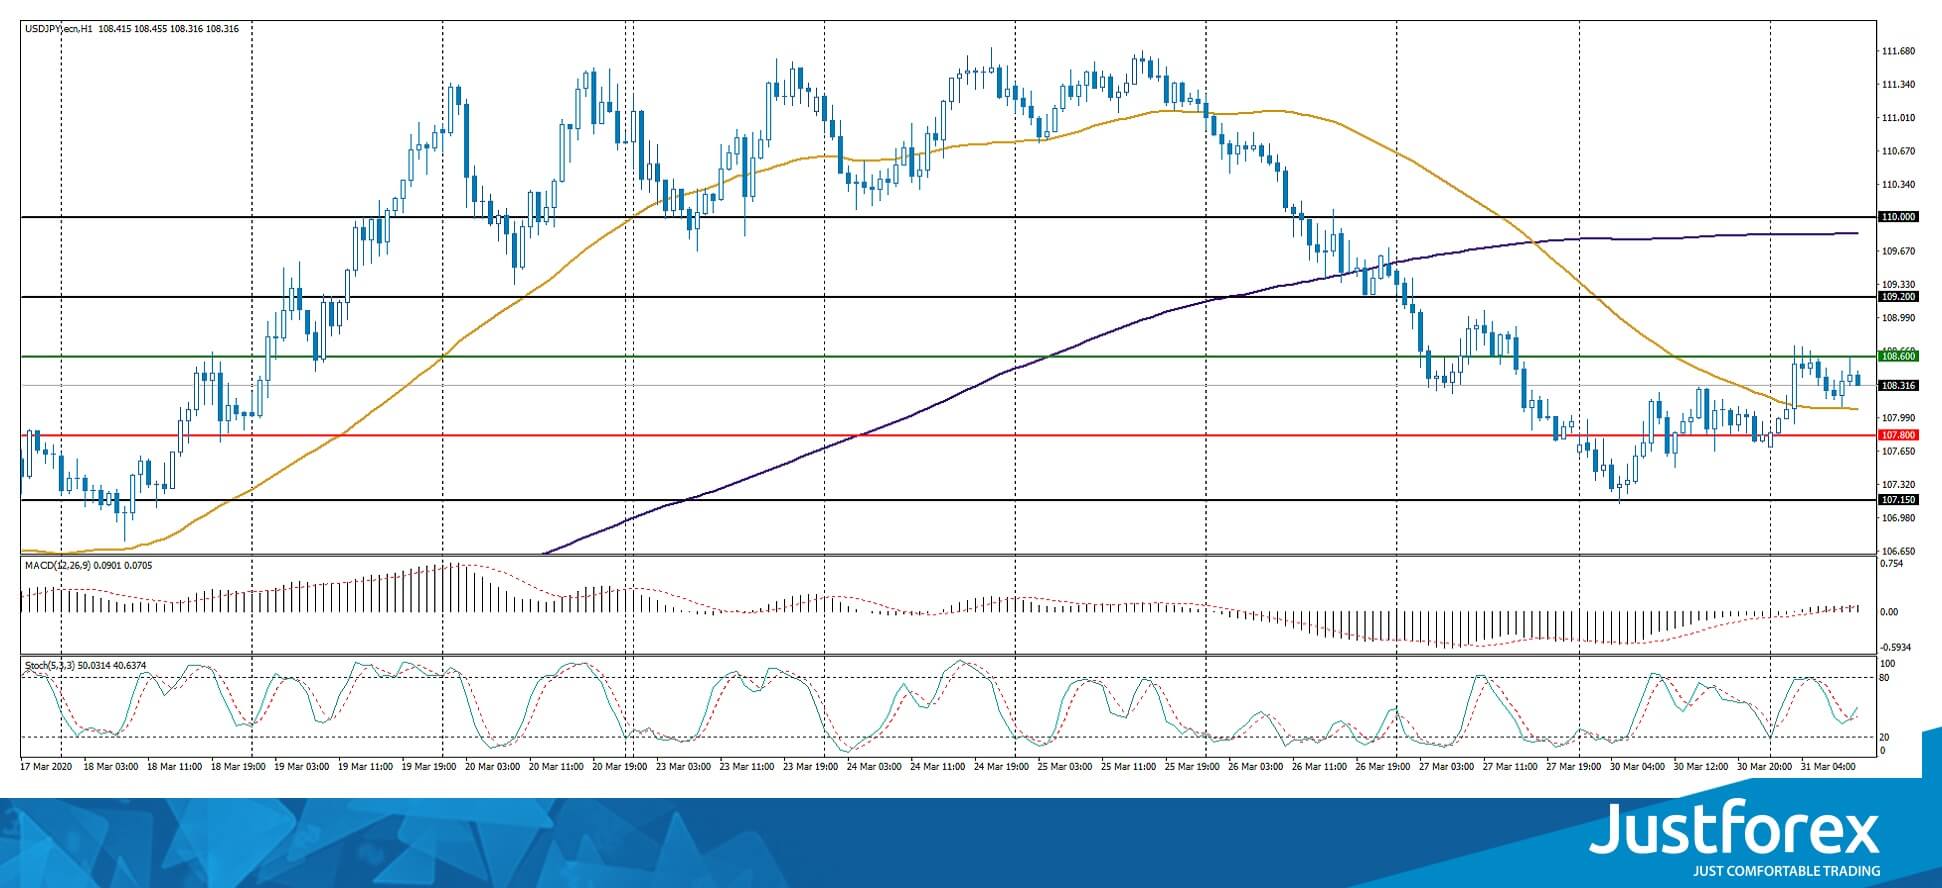
Indicators do not give accurate signals: the price has fixed between 50 MA and 100 MA.
The MACD histogram has moved into the positive zone, which indicates a possible correction of the USD/JPY currency pair.
The Stochastic Oscillator is in the neutral zone, the %K line crossed the %D line. There are no signals at the moment.
Trading recommendations
Support levels: 107.800, 107.150
Resistance levels: 108.600, 109.200, 110.000
If the price consolidates below 107.800, expect the quotes to drop toward 107.400-106.500.
Alternatively, the quotes could grow toward 109.000-109.500.


