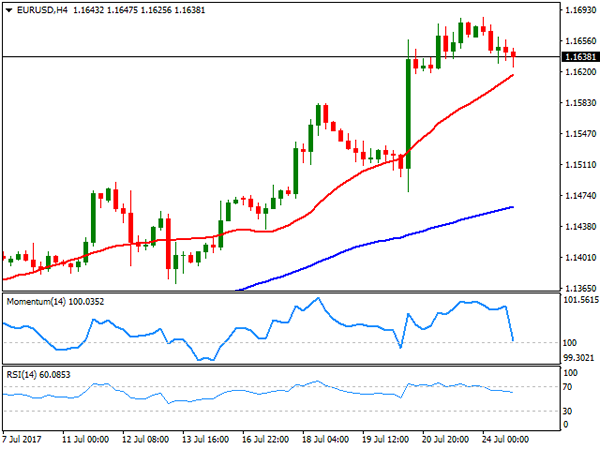
EUR/USD
Caution prevailed among FX investors at the beginning of the week, with the greenback ending the day marginally higher against most of its major rivals. The EUR/USD pair anyway, remained near a recent two-year high of 1.1683, as worse-than-expected US housing data interrupted dollar’s recovery. European data released at the beginning of the day failed to trigger EUR’s demand, as July Markit preliminary PMIs came below market’s expectations and previous month final readings. Growth in the private sector lost momentum according to Markit, with the composite index down to 55.8 from previous 56.3, its lowest in six months. In the US, however, the figures surprised to the upside, with the manufacturing and services sectors expanding at their fastest pace in four months, and the Composite index resulting at 54.2 from previous 53.9, a six-month high. Existing home sales, however, edged sharply lower in June, down by 1.8% to 5.52 million amid low supply.
From a technical point of view, the pair is set to correct further lower short term, as in the 4 hours chart technical indicators turned south, with the Momentum aiming to cross below its 100 level and the RSI indicator at 57. The 20 SMA in the mentioned chart stands around 1.1615, 2016 yearly high and the immediate support. Below the level, the corrective movement can extend down to 1.1580 June 18th high. Further declines seem unlikely ahead of Fed’s monetary policy announcement on Wednesday, moreover as the macroeconomic calendar has little relevant figures to offer this Tuesday.
Support levels: 1.1615 1.1580 1.1530
Resistance levels 1.16600 1.1710 1.1745
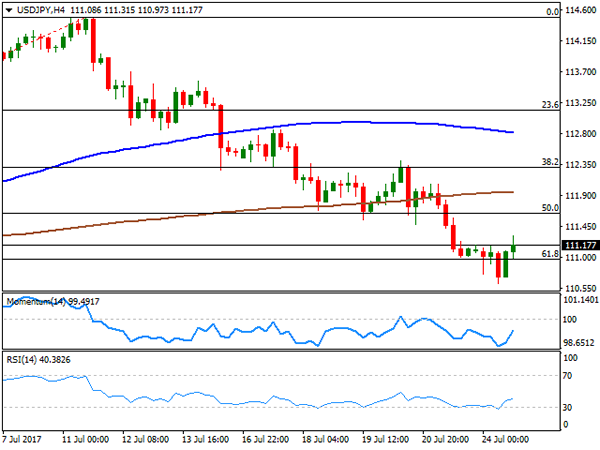
USD/JPY
The USD/JPY pair bounced from a fresh monthly low of 110.61 to end the day a couple of pips above Friday’s close. Data coming from Japan at the beginning of the day were generally soft, with the Nikkei Flash manufacturing PMI dropped to an eight-month low of 52.2 in July from 52.4 in June, while the Leading Index increased modestly when compared to April up to 104.6 from 104.2 in April. The Coincident index that reflects the current economic activity fell to 115.8 in May from a revised 117.1 in the prior month. US treasury yields bounced modestly, weighing on the yen during the US afternoon after a soft start to the day, with the 10-year benchmark up to 2.26% from previous 2.23%. The pair settled above a huge Fibonacci support at 110.90, the 61.8% retracement of its latest weekly advance after having spent most of the day below it, still at risk of falling further, as in the daily chart, the price remains below its 100 DMA, while technical indicators maintain their bearish slope within negative territory. In the 4 hours chart, technical indicators have bounced from oversold readings, but remain within negative territory while the price remains well below its 100 and 200 SMAs, limiting chances of a steeper advance.
Support levels: 110.90 110.55 110.20
Resistance levels: 111.45 111.90 112.35
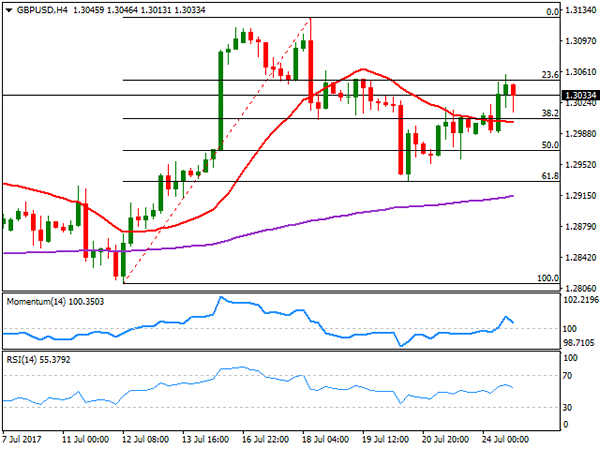
GBP/USD
The GBP/USD pair extended its Friday’s advance and recovered the 1.3000 threshold, reaching a 4-day high of 1.3057 before settling around 1.3030. There were no macroeconomic releases in the UK, with attention focused on UK’s Q2 GDP, to be released next Wednesday. Growth is expected to have decelerated in the three months to June, seen yearly basis at 1.7% from previous 2%. In the meantime, the 4 hours chart shows that the pair has pared gains around the 23.6% retracement of its latest bullish run the immediate resistance at 1.3050. Also, the pair has managed to advance above an anyway flat 20 SMA that converges with the 38.2% retracement of the same rally at 1.3010, while technical indicators have turned lower within positive territory, indicating that further gains are conditioned to the pair’s ability to advance beyond the mentioned Fibonacci resistance. In that case, the pair has scope to retest its July high at 1.3125, but further gains seem unlikely ahead of Wednesday’s macroeconomic events involving both economies.
Support levels: 1.3050 1.3085 1.3125
Resistance levels: 1.3010 1.2965 1.2920
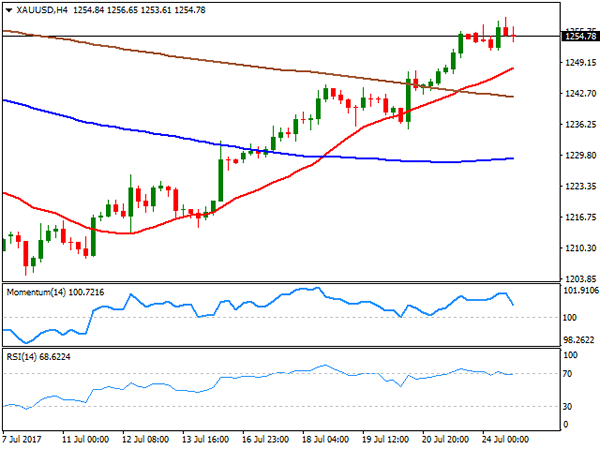
GOLD
Spot gold closed the day pretty much flat at $ 1,254.80 a troy ounce, having, however, extended its advance up to 1,258.75, its highest for this July. More political jitters in the US, as President Trump press secretary, Sean Spicer quit over the weekend, kept the dollar in check. Spot’s daily chart shows that the commodity held above its 100 DMA, while the Momentum extended its advance, no nearing overbought levels, whilst the RSI indicator consolidates around 64, all of which maintains the risk towards the upside. In the 4 hours chart, the 20 SMA has accelerated its advance beyond the 200 SMA, with the shortest now around 1,247.95, although technical indicators are currently retreating from overbought levels, suggesting a possible downward corrective movement ahead, particularly on a break below the daily low of 1,251.86.
Support levels: 1,251.90 1,242.50 1,236.30
Resistance levels: 1,258.80 1,266.60 1,274.10
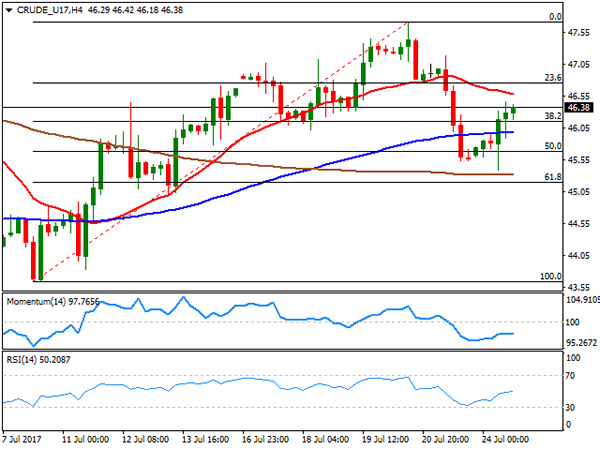
WTI CRUDE OIL
West Texas Intermediate crude oil futures closed at $46.38 a barrel, up from a daily low of 45.39, as in the OPEC and non-OPEC producers’ meeting that took place it Saint Petersburg, Nigeria agreed to limit its oil output to 1.8 million barrels per day. Earlier on the day, the Saudi Energy minister announced that the kingdom will cut its oil allocations to customers during August, capping its oil exports at 6.6 million bpd. The daily chart shows that the black gold regained its positive bias as in the daily chart, the price settled back above it 20 DMA, also above the 38.2% retracement of its latest downward move at 46.15, whilst technical indicators resumed their advances after bouncing at their mid-lines. In the 4 hours chart, however, technical indicators remain below their mid-lines, with the Momentum aiming north, but the RSI flat around 49, and a bearish 20 SMA capping the upside around 46.20.
Support levels: 46.10 45.50 44.85
Resistance levels: 46.25 46.80 47.40
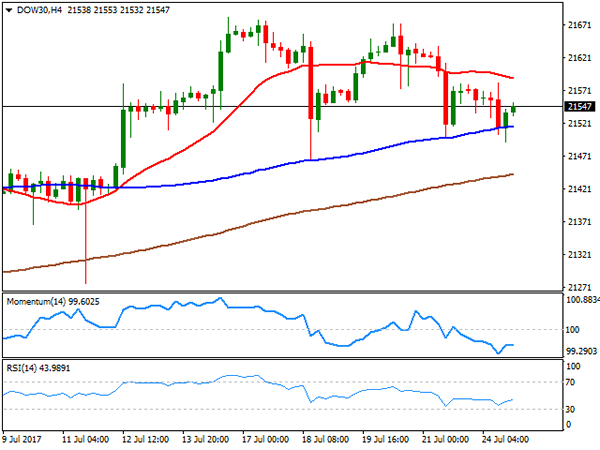
DJIA
Wall Street closed mixed, with the Dow Jones Industrial Average down 56 points or 0.26%, to 21,523.58 and the S&P down 2 points, to 2.470.06. The Nasdaq Composite, on the other hand, set another record high, adding 23 points and finishing at 6,410.81. Within the Dow, Caterpillar was the best performer, up 1.55%, followed by Apple that added 1.29%. General Electric was the worst performer, shedding 1.87%, followed by Nike that closed 1.64%. From a technical point of view, the daily chart for the DJIA shows that the index keeps losing upward strength, but the movement remains as corrective, as its not far from record highs and around June’s top. The mentioned chart shows that despite a brief slide below it, the index settled above a bullish 20 SMA, whilst the Momentum indicator turned south within positive territory as the RSI indicator extended its decline, currently at 53. While this seems not enough to confirm a bearish extension, the risk of a downward move increased. Shorter term, and according to the 4 hours chart, technical indicators lost upward strength after a modest bounce from near oversold levels, while the index remained below a bearish 20 SMA, supporting the longer term perspective.
Support levels: 21,493 21,464 21,418
Resistance levels: 21,570 21,628 21,673
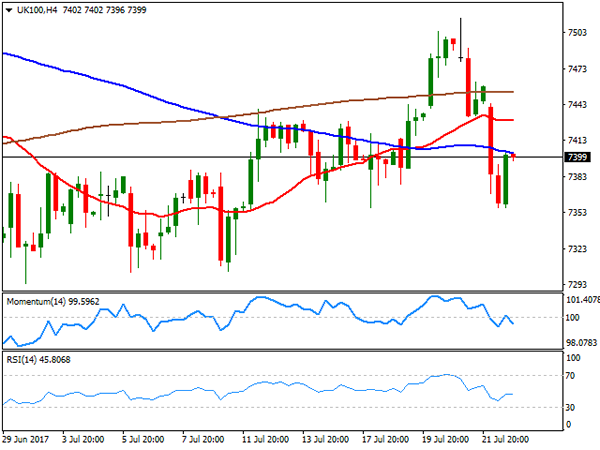
FTSE100
The FTSE 100 closed at7,377.73, down 1.01% or 74 points, with falls in airlines shares leading the way lower, also weighed by a stronger Pound. Ryanair said that it will cut its fares by as much as 9% on some routes during the next few months, hitting the sector. The best performer was Micro Focus International that added 1.46%, followed by Anglo American that gained 1.19%. Reckitt Benckiser Group led decliners, down 3.27%, followed by Next that shed 3.06%. Down for a second consecutive day, the index is currently a few points above the 20 and 100 SMAs, both converging at 7,385 and offering an immediate support, whilst technical indicators turned south, currently about to enter negative territory. In the 4 hours chart, the index is biased lower, as the index remains below all of its moving averages, while technical indicators turned south after failing to surpass their mid-lines.
Support levels: 7,385 7,434 7,290
Resistance levels: 7,435 7,482 7,518
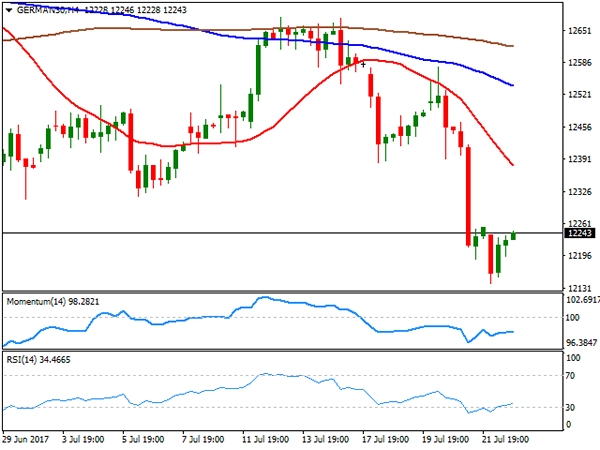
DAX
European equities closed mixed this Monday, with the German DAX ending at 12,208.95, down by 31 points as softer-than-expected preliminary PMIs for July and a decline in the automotive sector weighed. Carmakers fell amid fears of a new scandal in the sector, on allegations the companies colluded on technology for decades. Bayerische Motoren led decliners, down 2.53%, followed by Daimler that shed 2.15%. Banks led gainers, with Commerzbank up 3.24% and Deutsche Bank adding 3.02%. The index bounced modestly in after-hours trading, heading into the Asian opening around 12,250, but still looking bearish, given that in the daily chart, the index is well below its 20 and 100 DMAs, whilst technical indicators stand pat within negative territory. In the 4 hours chart, the index remains far below its moving averages, whilst technical indicators lost upward strength within bearish territory, after a modest correction from oversold readings, also in line with additional slides.
Support levels: 12,234 12,190 12,153
Resistance levels: 12,278 12,310 12,367