
The EUR/USD currency pair
Technical indicators of the currency pair:
Prev Open: 1.09531
Open: 1.09695
% chg. over the last day: +0.26
Day’s range: 1.09251 – 1.09737
52 wk range: 1.0777 – 1.1494
The EUR/USD currency pair has become stable after a sharp increase at the end of last week. The trading instrument has set new local highs. Washington is considering imposing new sanctions against Beijing, finding it guilty of the COVID-19 epidemic. The number of coronavirus infected in the world exceeded 3.5 million. At the moment, EUR/USD quotes are consolidating in the range of 1.0925-1.0970. The single currency has the potential for further growth. Positions should be opened from key levels.
The Economic News Feed for 04.05.2020
At 10:55 (GMT+3:00), German manufacturing PMI will be published.
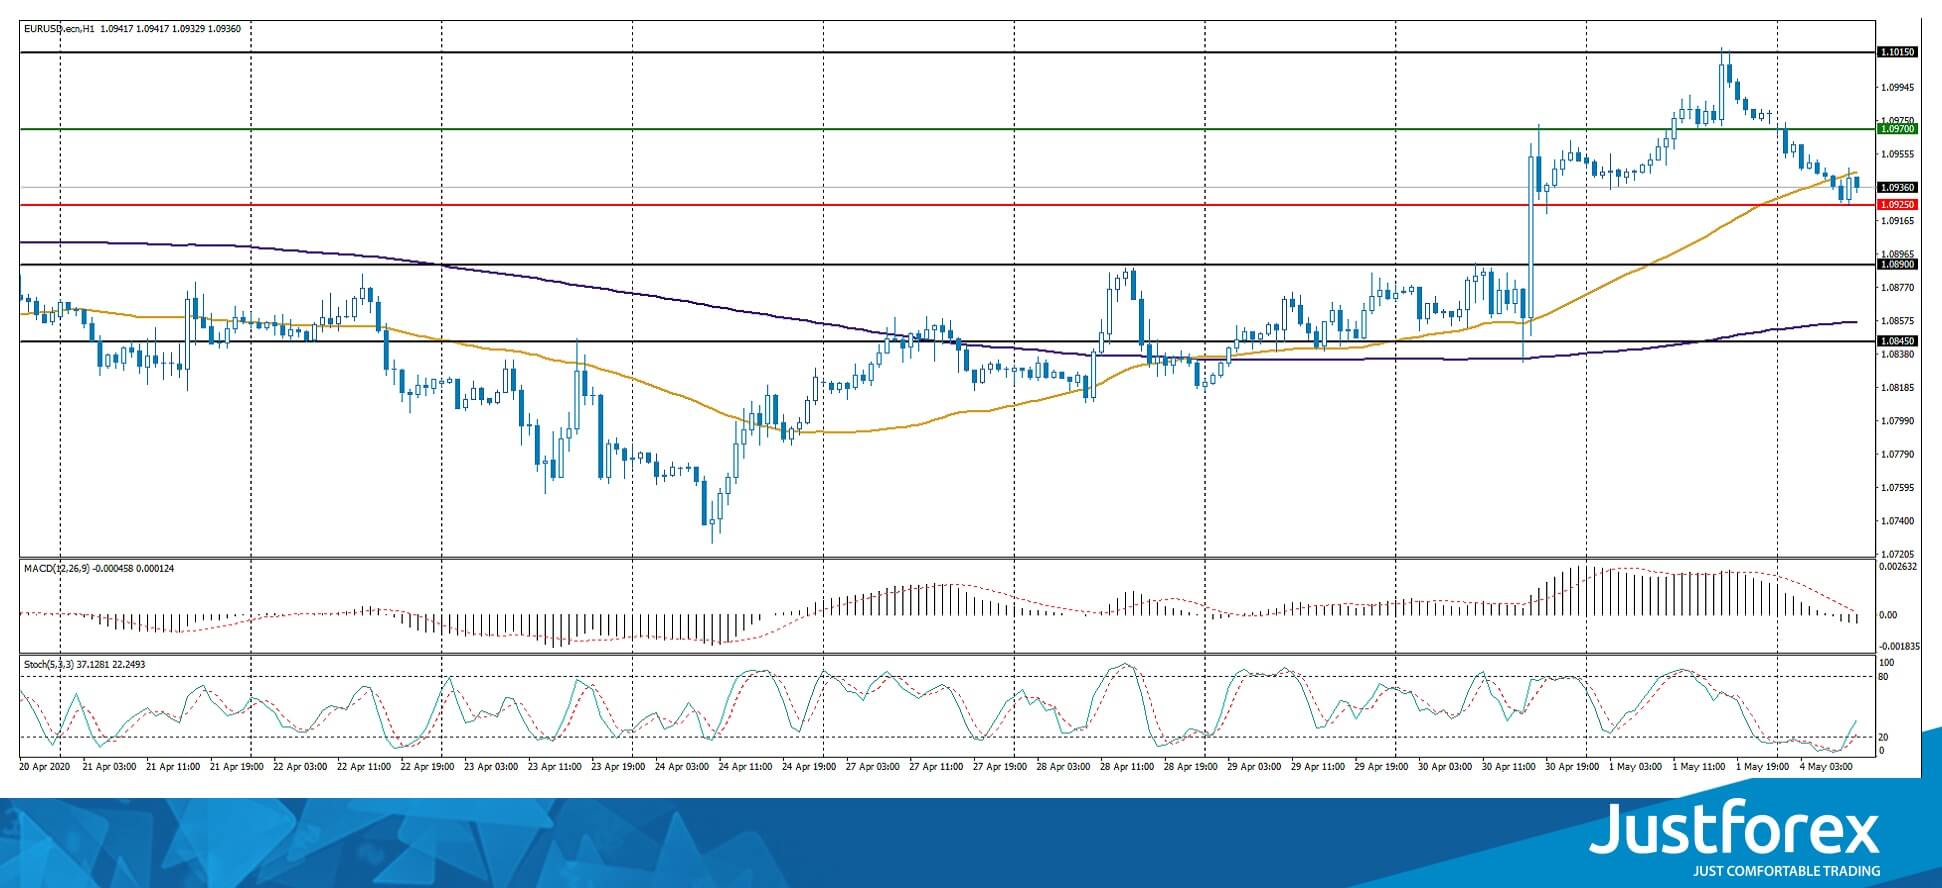
Indicators do not give accurate signals: the price has crossed 50 MA.
The MACD histogram has started declining, indicating the development of the correction movement.
Stochastic Oscillator is in the neutral zone, the %K line is above the %D line, which gives a signal to buy EUR/USD.
Trading recommendations
Support levels: 1.0925, 1.0890, 1.0845
Resistance levels: 1.0970, 1.1015
If the price fixes above the level of 1.0970, further growth of the EUR/USD currency pair is expected. The movement is tending to 1.1015-1.1040.
An alternative could be a decrease in the EUR/USD quotes to 1.0890-1.0860.
The GBP/USD currency pair
Technical indicators of the currency pair:
Prev Open: 1.25838
Open: 1.24823
% chg. over the last day: -0.71
Day’s range: 1.24242 – 1.24855
52 wk range: 1.1466 – 1.3516
GBP/USD quotes have been declining. The British pound has updated local lows. The demand for risky assets has weakened. At the moment, the GBP/USD currency pair is consolidating. The local support and resistance levels are 1.2425 and 1.2485, respectively. Financial market participants expect additional drivers. A trading instrument has the potential for further decline. We recommend opening positions from key support and resistance levels.
The news feed on the UK economy is calm.
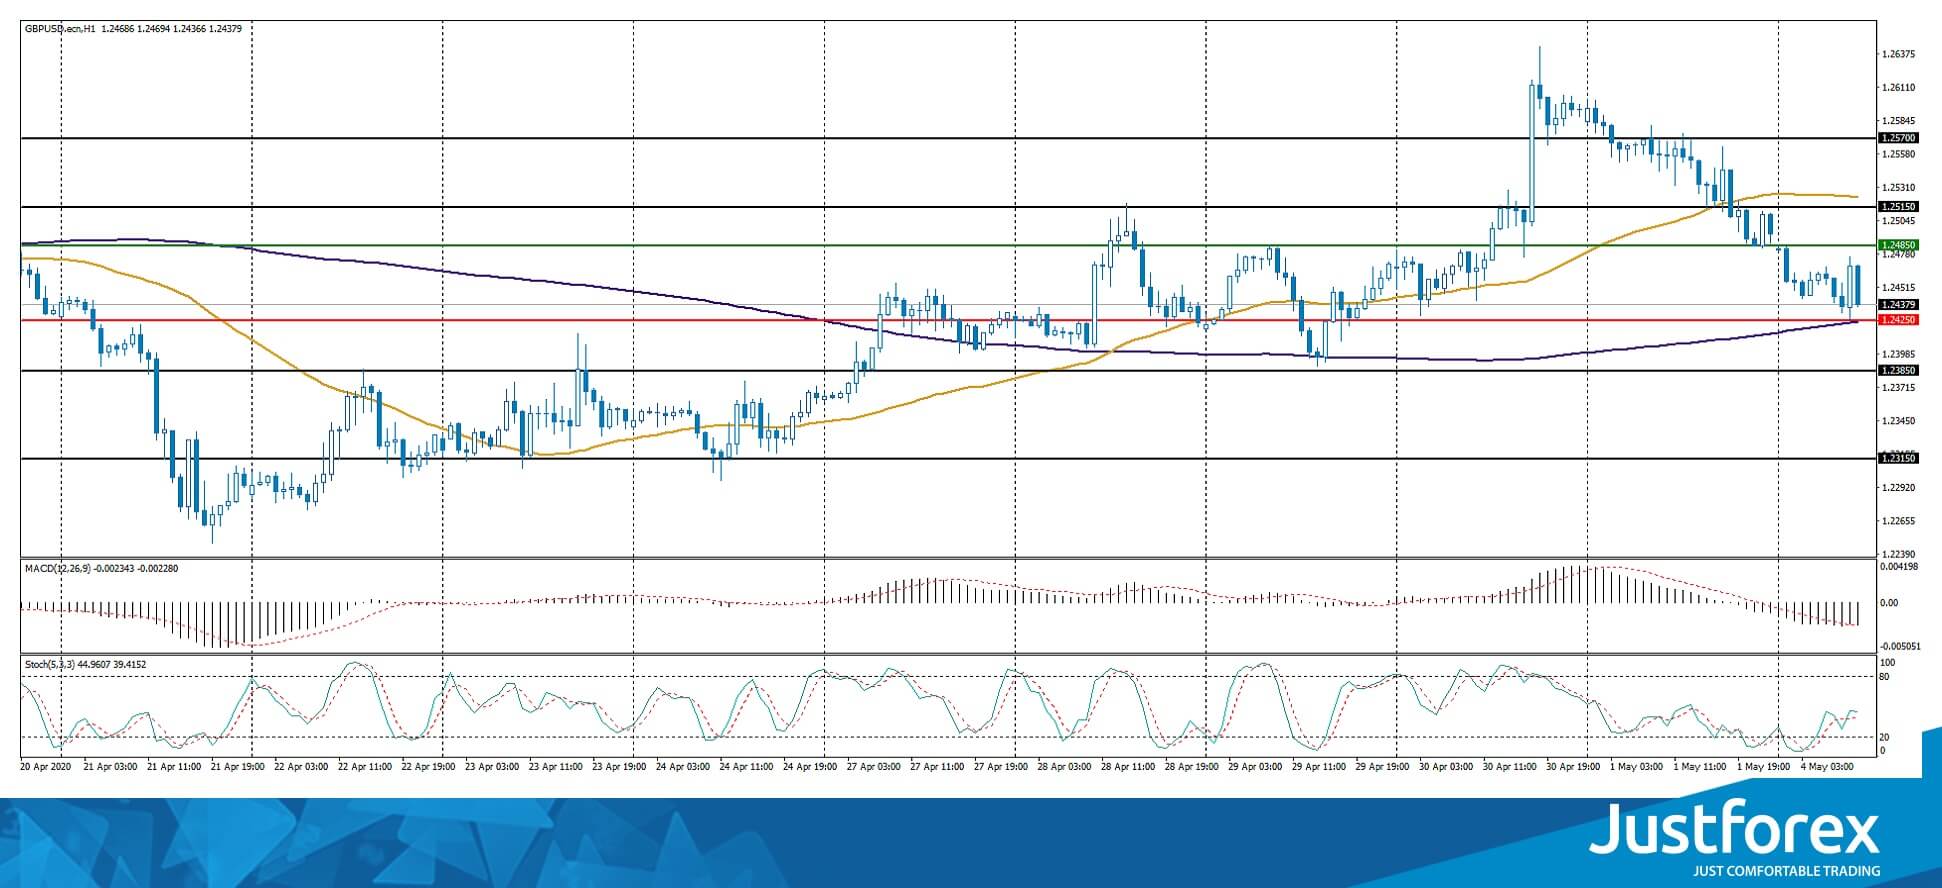
Indicators do not give accurate signals: the price has fixed between 50 MA and 100 MA.
The MACD histogram is in the negative zone, indicating the bearish sentiment.
Stochastic Oscillator is in the neutral zone, the %K line has crossed the %D line. There are no signals at the moment.
Trading recommendations
Support levels: 1.2425, 1.2385, 1.2315
Resistance levels: 1.2485, 1.2515, 1.2570
If the price fixes below the support level of 1.2425, a further drop in GBP/USD quotes is expected. The movement is tending to 1.2380-1.2350.
An alternative could be the growth of the GBP/USD currency pair to 1.2530-1.2560.
The USD/CAD currency pair
Technical indicators of the currency pair:
Prev Open: 1.39385
Open: 1.40828
% chg. over the last day: +1.01
Day’s range: 1.40775 – 1.41524
52 wk range: 1.2949 – 1.4668
The bullish sentiment prevails on the USD/CAD currency pair. The trading instrument has set new local highs. The loonie is currently consolidating in the range of 1.4075-1.4150. The demand for risky assets is still low. The Canadian dollar has the potential for further decline against the greenback. We recommend paying attention to the dynamics of oil quotes. Positions should be opened from key levels.
The news feed on Canada’s economy is calm.
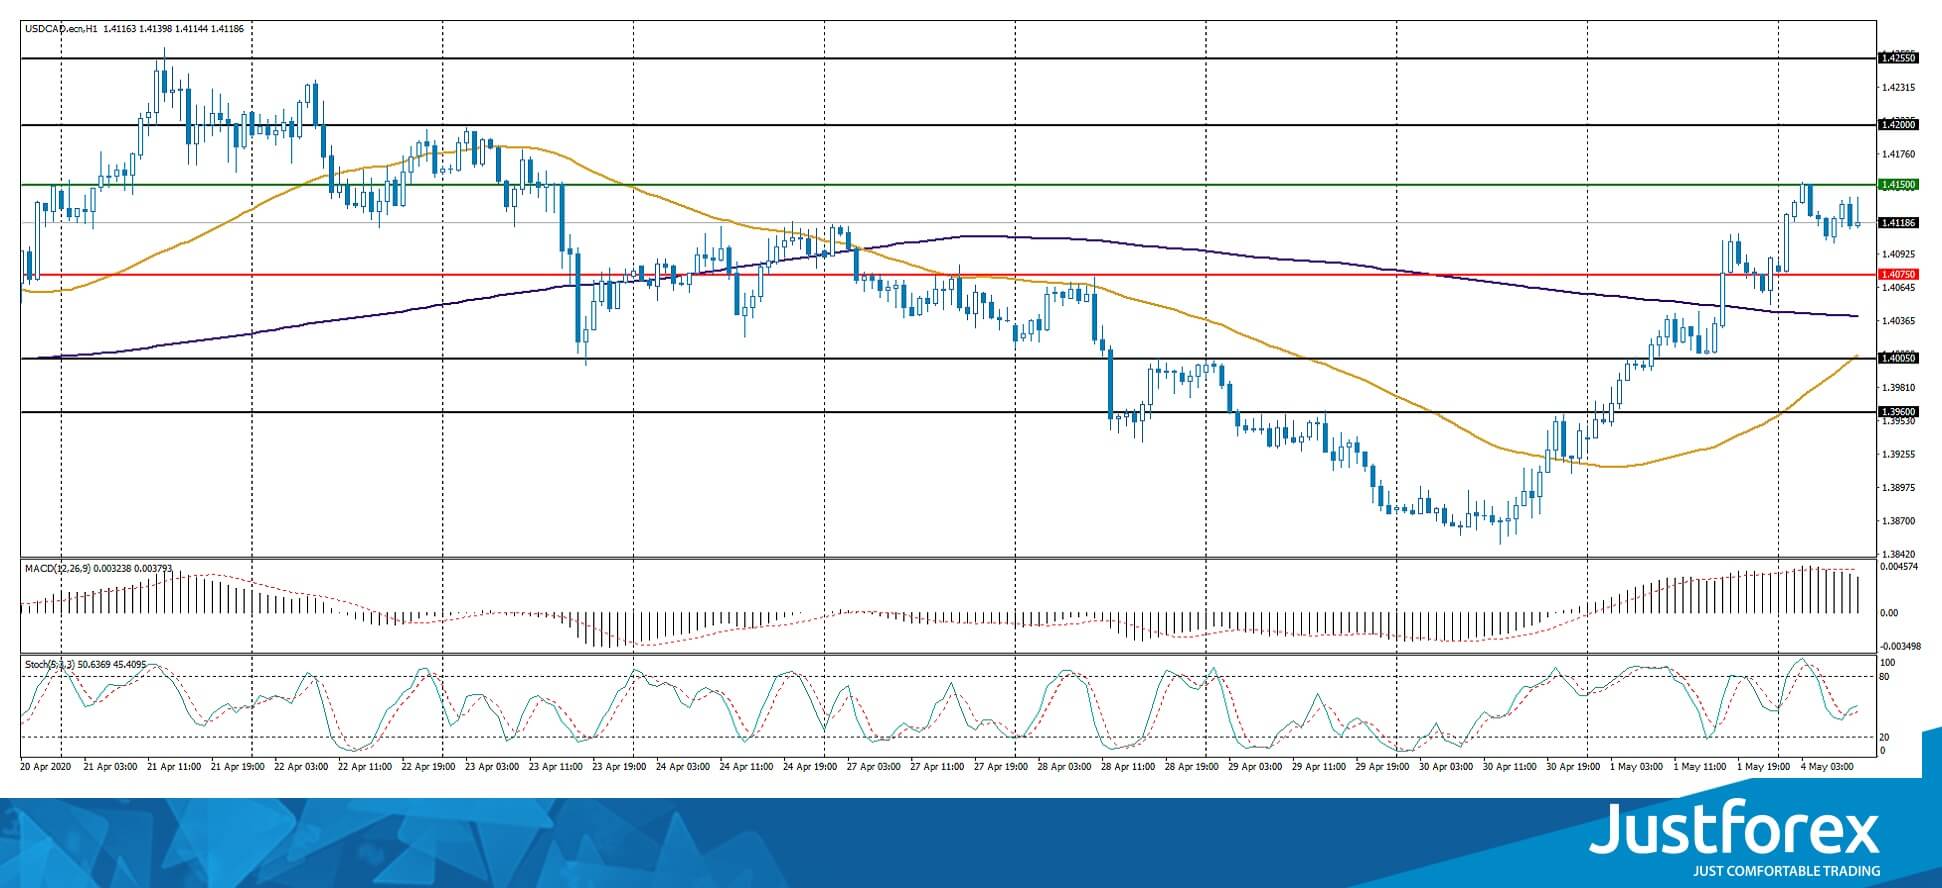
Indicators signal the power of buyers: the price has fixed above 100 MA.
The MACD histogram is in the positive zone, but below the signal line, which gives a weak signal to buy USD/CAD.
Stochastic Oscillator is in the neutral zone, the %K line has crossed the %D line. There are no signals at the moment.
Trading recommendations
Support levels: 1.4075, 1.4005, 1.3960
Resistance levels: 1.4150, 1.4200, 1.4255
If the price fixes above the resistance level of 1.4150, further growth of the USD/CAD quotes is expected. The movement is tending to 1.4200-1.4230.
An alternative could be a decrease in the USD/CAD currency pair to 1.4050-1.4010.
The USD/JPY currency pair
Technical indicators of the currency pair:
Prev Open: 107.118
Open: 106.800
% chg. over the last day: -0.22
Day’s range: 106.670 – 106.943
52 wk range: 101.19 – 112.41
There is an ambiguous technical pattern on the USD/JPY currency pair. Quotes are in a sideways trend. There is no defined trend. The trading instrument is testing local support and resistance levels: 106.65 and 106.95, respectively. The USD/JPY currency pair is tending to decline. We recommend paying attention to the dynamics of US government bonds yield. Positions should be opened from key levels.
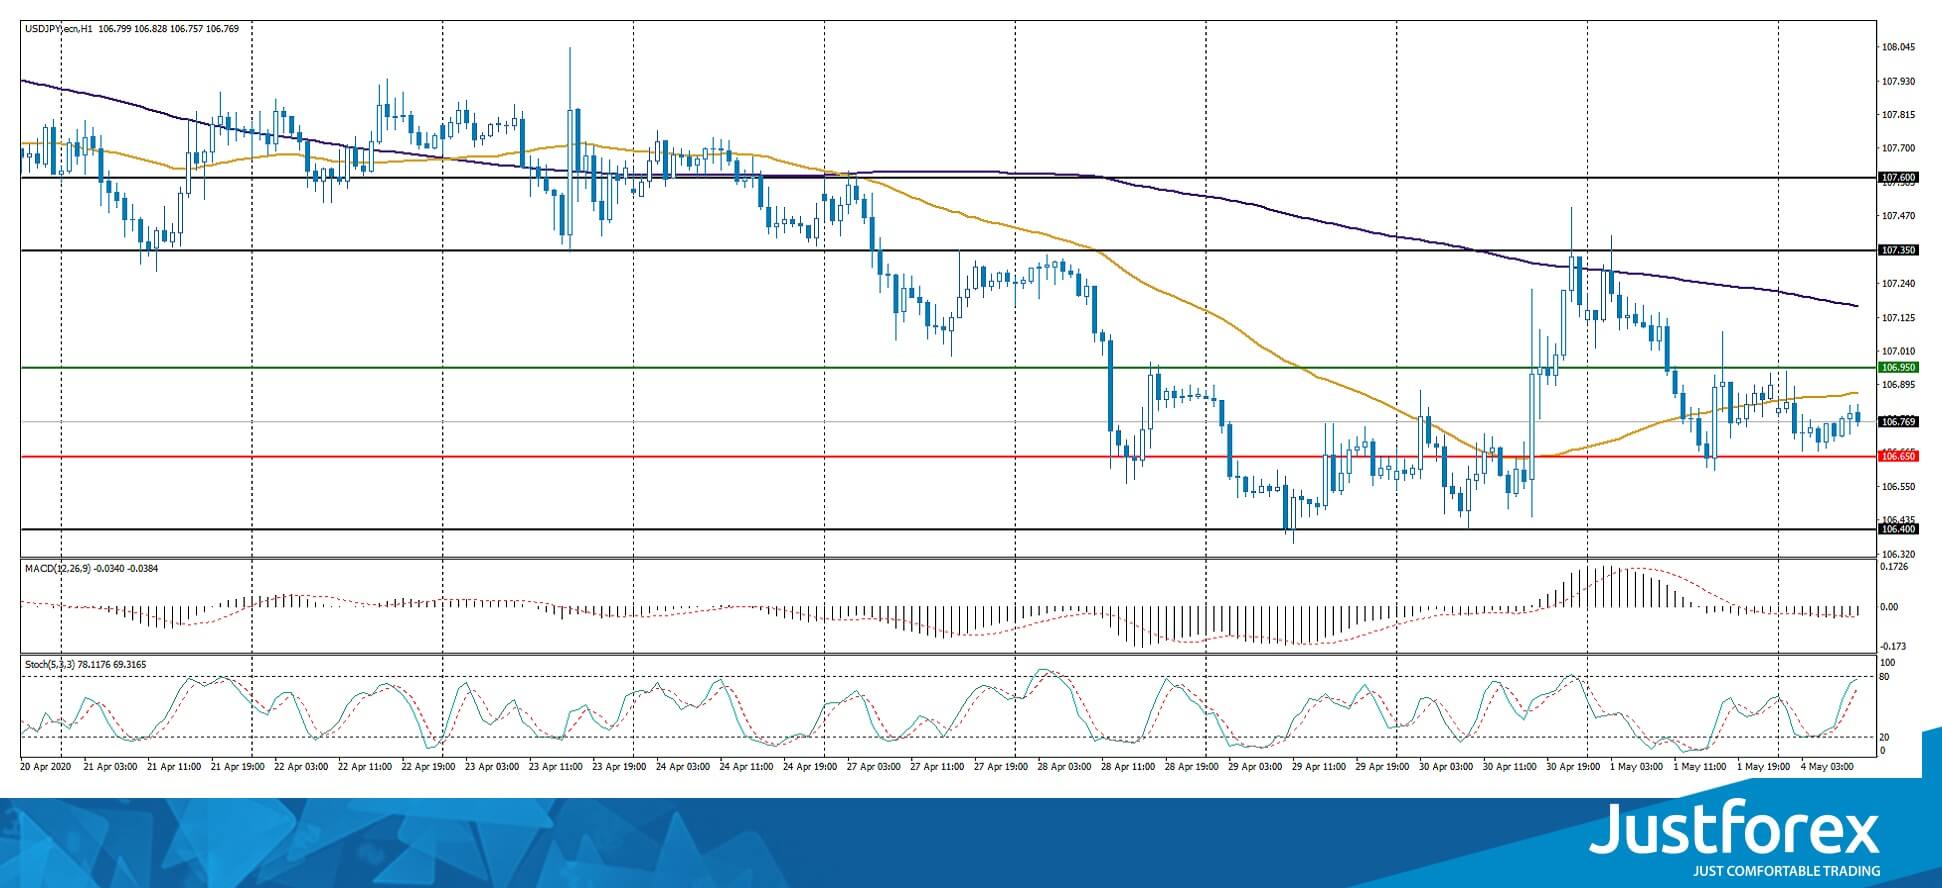
Indicators do not give accurate signals: the price has crossed 50 MA.
The MACD histogram is in the negative zone, but above the signal line, which gives a weak signal to sell USD/JPY.
Stochastic Oscillator is in the neutral zone, the %K line is above the %D line, which indicates the bullish sentiment.
Trading recommendations
Support levels: 106.65, 106.40
Resistance levels: 106.95, 107.35, 107.60
If the price fixes below 106.65, USD/JPY quotes are expected to fall. The movement is tending to 106.40-106.20.
An alternative could be the growth of the USD/JPY currency pair to 107.20-107.40.


