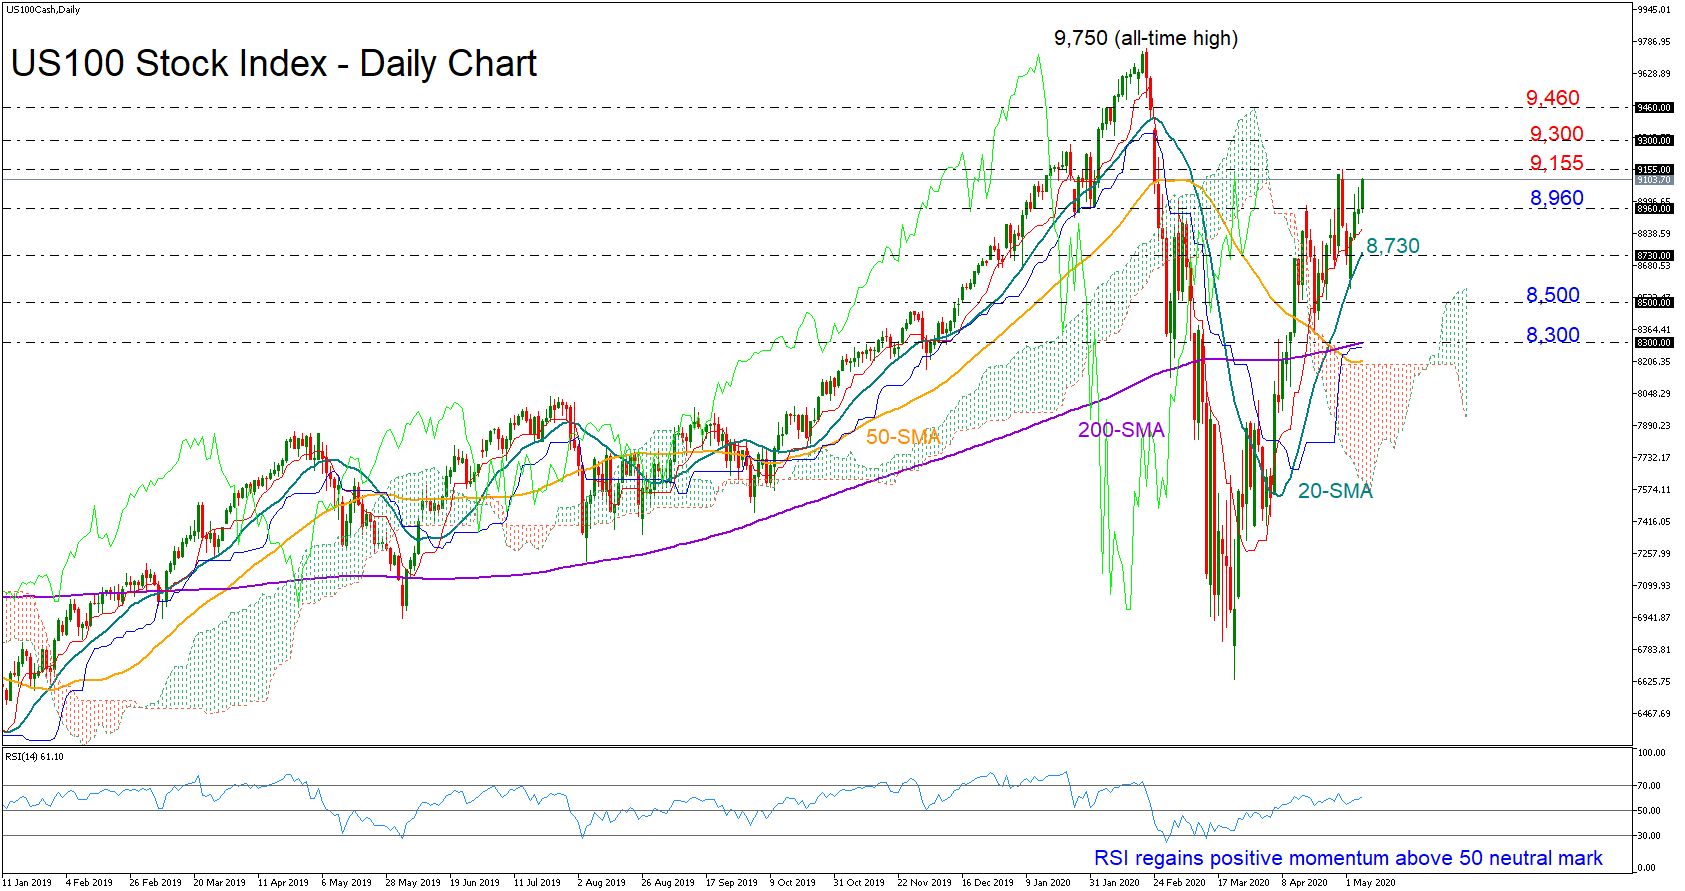
The US 100 stock index (cash) is recording its fourth consecutive green day thanks to the 20-day simple moving average (SMA), which managed to terminate the latest selling action.
Clearing April’s high of 9,155 and further extending the uptrend is now the target as the upward-sloping RSI is currently suggesting. If that is the case, resistance could possibly run up to 9,300 and if buyers persist above that mark, the market could re-test the 9,460 barrier ahead of the 9,750 all-time high.
Alternatively, the 8,960 level may immediately curb any downside correction towards the 20-day SMA at 8,730, a break of which could renew selling pressure until the 8,300-8,500 support area.
Meanwhile in the medium-term picture, the bearish outlook switched to neutral following the violation of the 8,960 number. That said, the bearish cross between the 50- and 200-day SMAs is still in place, keeping some caution about whether the sentiment will keep improving.
In short, the US 100 index could experience additional buying interest if it stretches above 9,155, while selling interest could become noticeable below the 20-day SMA.