
The EUR/USD currency pair
Technical indicators of the currency pair:
Prev Open: 1.09169
Open: 1.09231
% chg. over the last day: +0.09
Day’s range: 1.09187 – 1.09601
52 wk range: 1.0777 – 1.1494
The EUR/USD currency pair has become stable after a sharp increase since the beginning of this week. The news that France and Germany have taken a joint initiative to create a €500bn EU rescue fund supports the euro. Currently, EUR/USD quotes are consolidating. The key range is 1.0920-1.0970. Today, investors will assess the FOMC meeting minutes, which may have a significant impact on the dynamics of currency majors. We recommend opening positions from key levels.
The Economic News Feed for 20.05.2020
Consumer price index in the Eurozone at 12:00 (GMT+3:00);
FOMC meeting minutes at 21:00 (GMT+3:00).
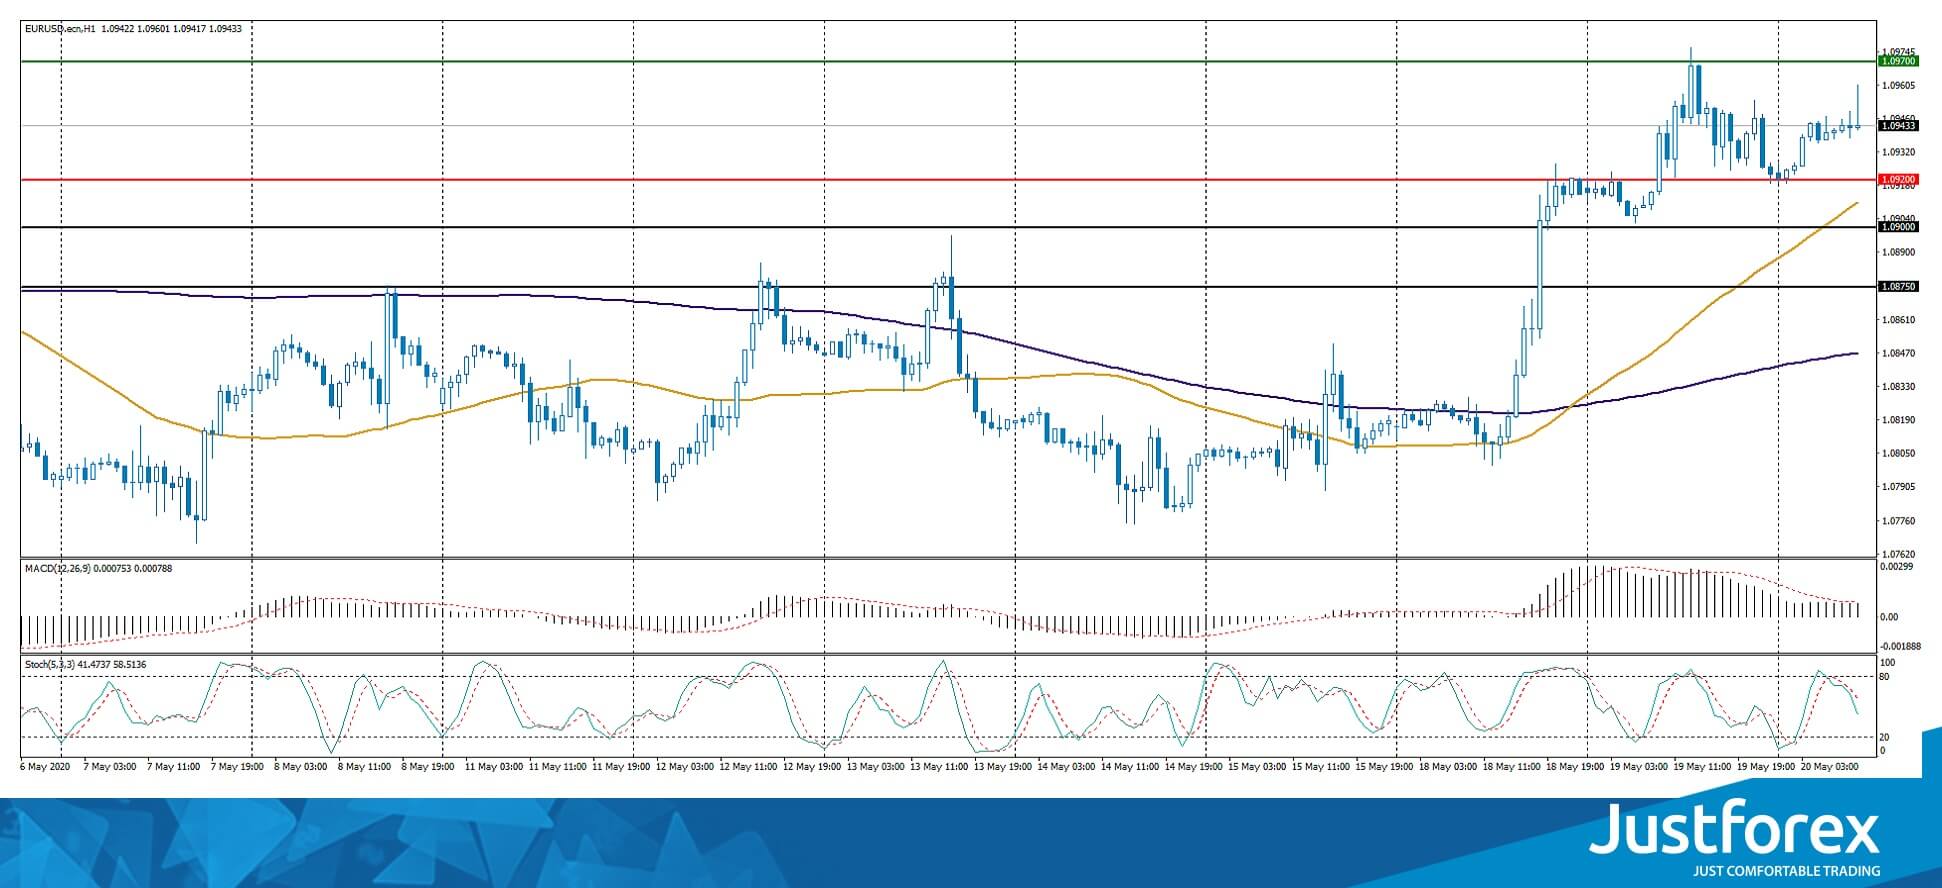
Indicators signal the power of buyers: the price has fixed above 50 MA and 100 MA.
The MACD histogram is in the positive zone, indicating the bullish sentiment.
Stochastic Oscillator is in the neutral zone, the %K line is below the %D line, which gives a signal to sell EUR/USD.
Trading recommendations
Support levels: 1.0920, 1.0900, 1.0875
Resistance levels: 1.0970, 1.1000
If the price fixes above 1.0970, further growth of the EUR/USD currency pair is expected. The movement is tending to 1.1000-1.1030.
An alternative could be a drop in EUR/USD quotes to 1.0900-1.0870.
The GBP/USD currency pair
Technical indicators of the currency pair:
Prev Open: 1.21932
Open: 1.22539
% chg. over the last day: +0.49
Day’s range: 1.22213 – 1.22764
52 wk range: 1.1466 – 1.3516
GBP/USD quotes are consolidating. The technical pattern is ambiguous. The British pound is testing local support and resistance levels: 1.2215 and 1.2280, respectively. Financial market participants have taken a wait-and-see attitude before the publication of the FOMC meeting minutes. The GBP/USD currency pair has the potential for further growth. We recommend opening positions from key levels.
In April, the UK consumer price index slowed down and counted to 0.8% (y/y). Market expectations were at 0.9%
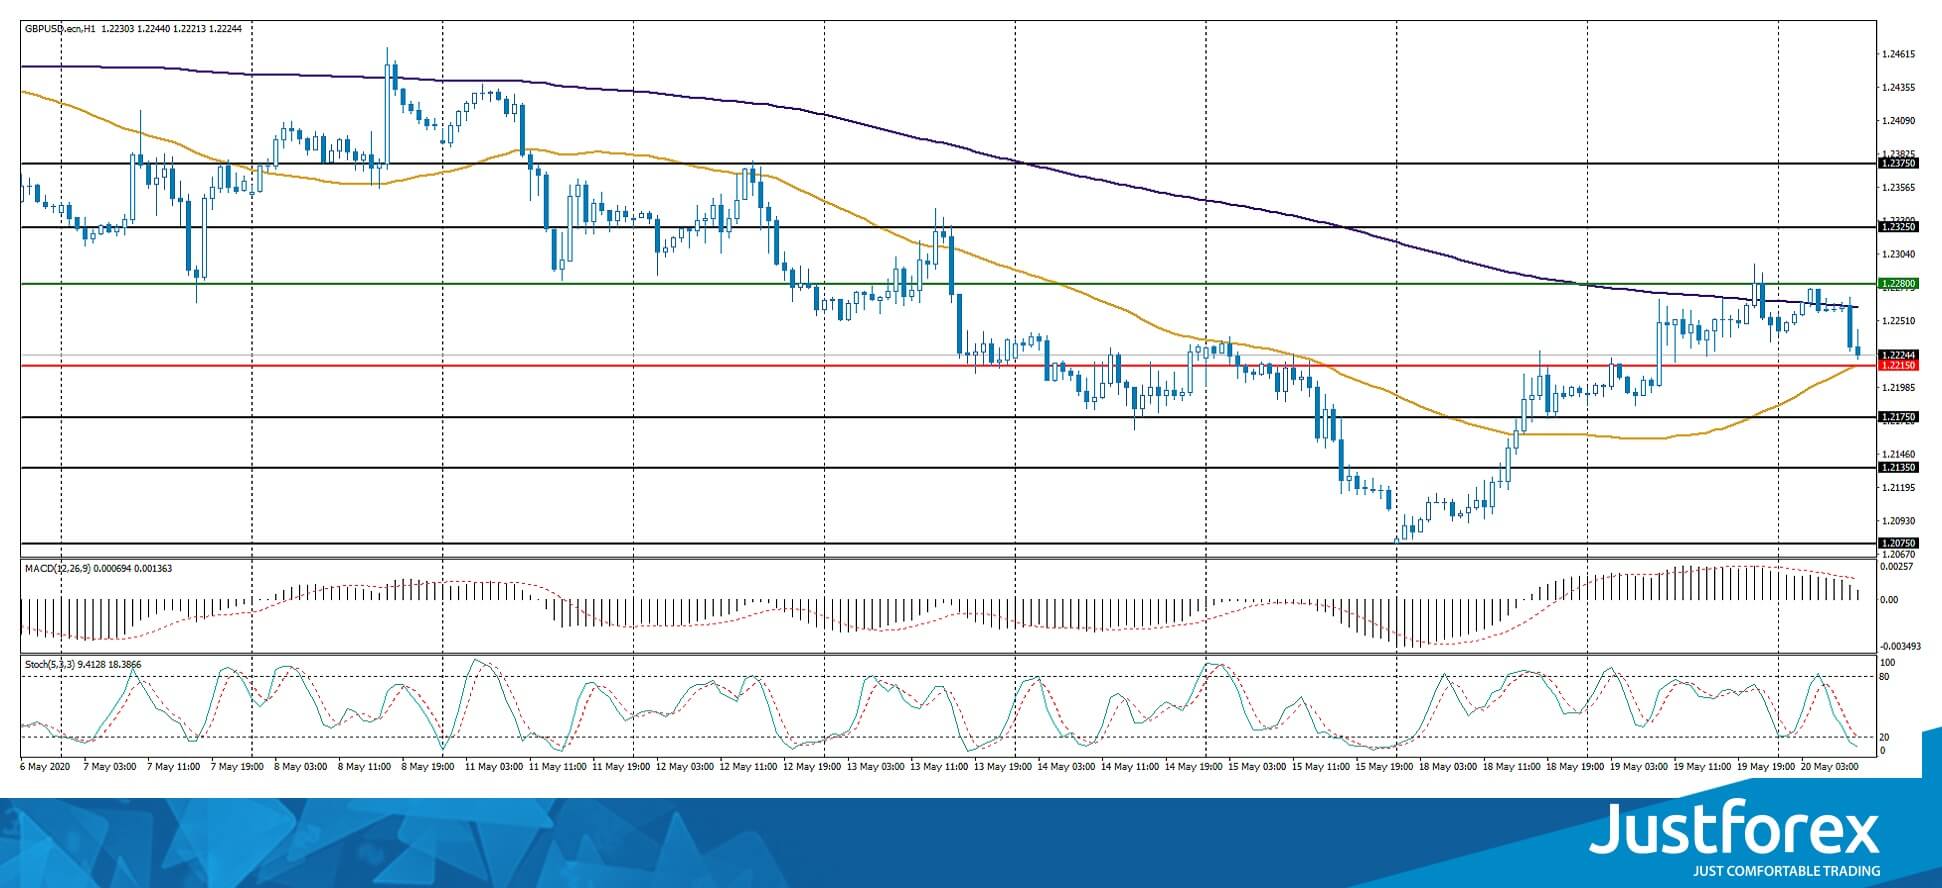
Indicators do not give accurate signals: the price has crossed 50 MA and 100 MA.
The MACD histogram is in the positive zone, but below the signal line, which gives a weak signal to buy GBP/USD.
Stochastic Oscillator is in the neutral zone, the %K line is below the %D line, which indicates the bearish sentiment.
Trading recommendations
Support levels: 1.2215, 1.2175, 1.2135
Resistance levels: 1.2280, 1.2325, 1.2375
If the price fixes above 1.2280, further growth of GBP/USD quotes is expected. The movement is tending to 1.2320-1.2340.
An alternative could be a decrease in the GBP/USD currency pair to 1.2175-1.2140.
The USD/CAD currency pair
Technical indicators of the currency pair:
Prev Open: 1.39377
Open: 1.39402
% chg. over the last day: +0.05
Day’s range: 1.39169 – 1.39606
52 wk range: 1.2949 – 1.4668
The USD/CAD currency pair has become stable after a sharp fall. The loonie is currently consolidating. The local support and resistance levels are: 1.3910 and 1.3960, respectively. We expect important economic releases from Canada and the US. The Canadian dollar has the potential for further growth against the US currency. We recommend paying attention to the dynamics of oil quotes. Positions should be opened from key levels.
At 15:30 (GMT+3:00), a report on inflation will be published in Canada.
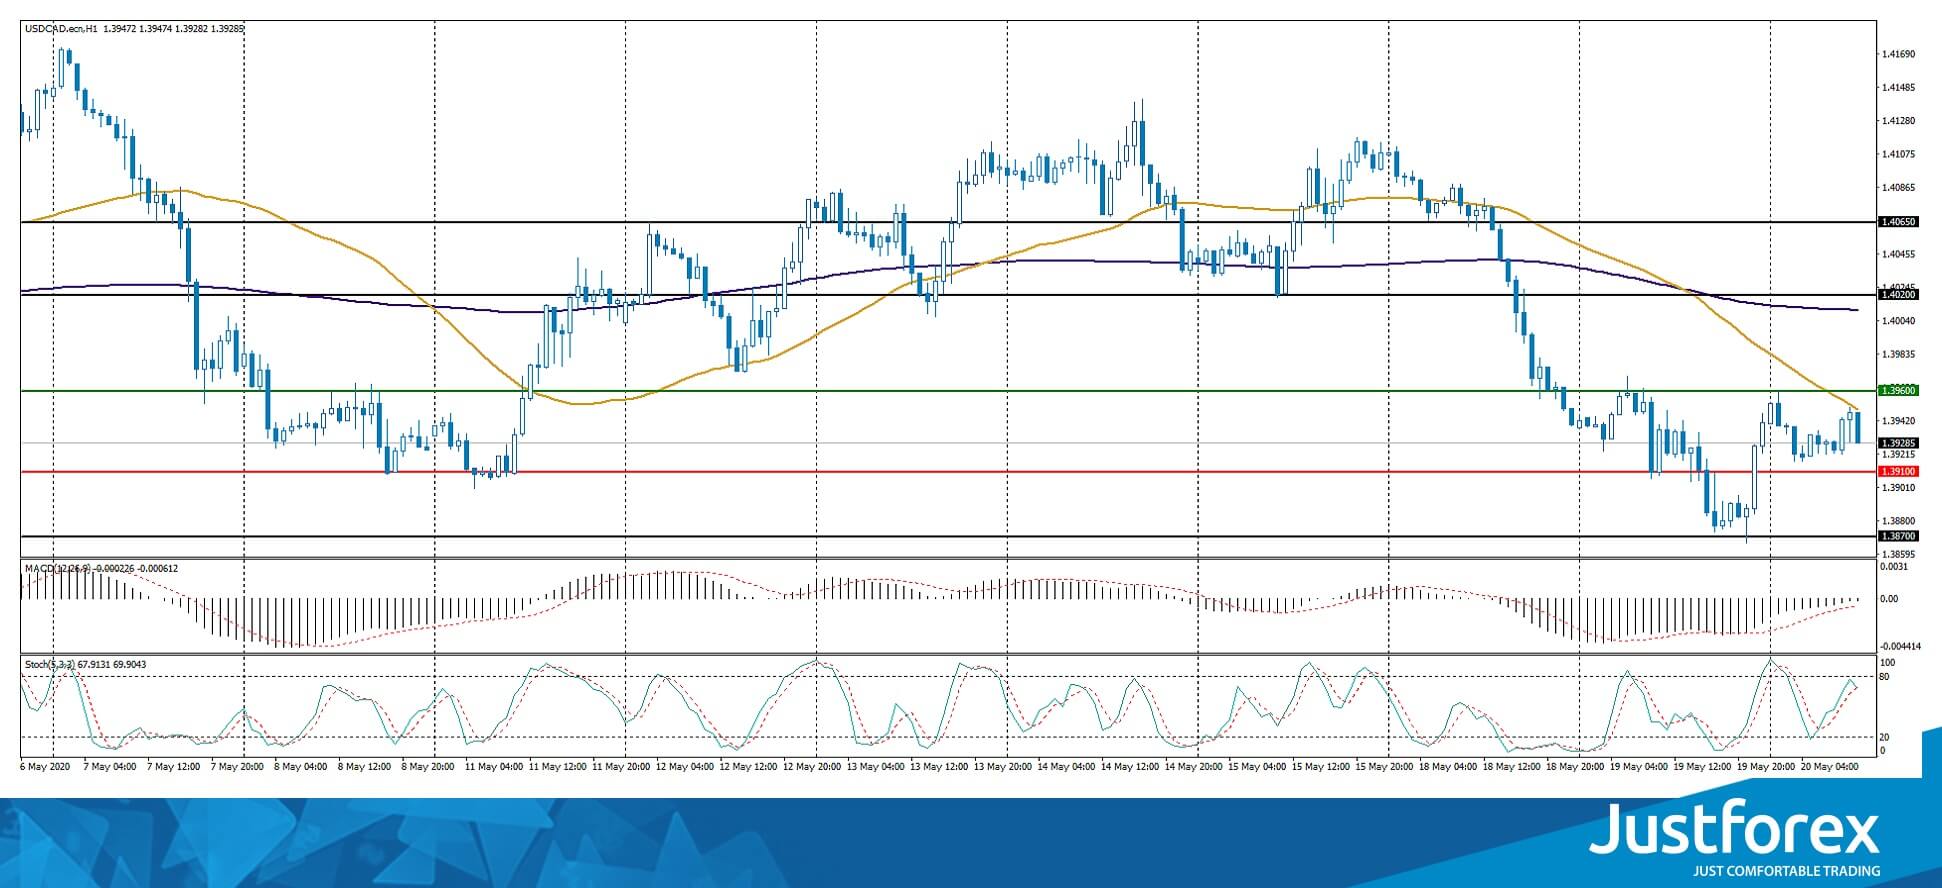
Indicators do not give accurate signals: the price is testing 50 MA.
The MACD histogram is near the 0 mark.
Stochastic Oscillator is in the neutral zone, the %K line has crossed the %D line. There are no signals at the moment.
Trading recommendations
Support levels: 1.3910, 1.3870
Resistance levels: 1.3960, 1.4020, 1.4065
If the price fixes below the support level of 1.3910, a further drop in USD/CAD quotes is expected. The movement is tending to 1.3870-1.3850.
An alternative could be the growth of the USD/CAD currency pair to 1.4000-1.4030.
The USD/JPY currency pair
Technical indicators of the currency pair:
Prev Open: 107.282
Open: 107.699
% chg. over the last day: +0.49
Day’s range: 107.625 – 107.983
52 wk range: 101.19 – 112.41
The USD/JPY currency pair has been growing after a prolonged consolidation. The trading instrument has set new monthly highs. At the moment, USD/JPY quotes are consolidating. The key range is 107.60-108.00. We expect the publication of the FOMC meeting minutes. We also recommend paying attention to the dynamics of US government bonds yield. Positions should be opened from key levels.
The news feed on Japan’s economy is calm.
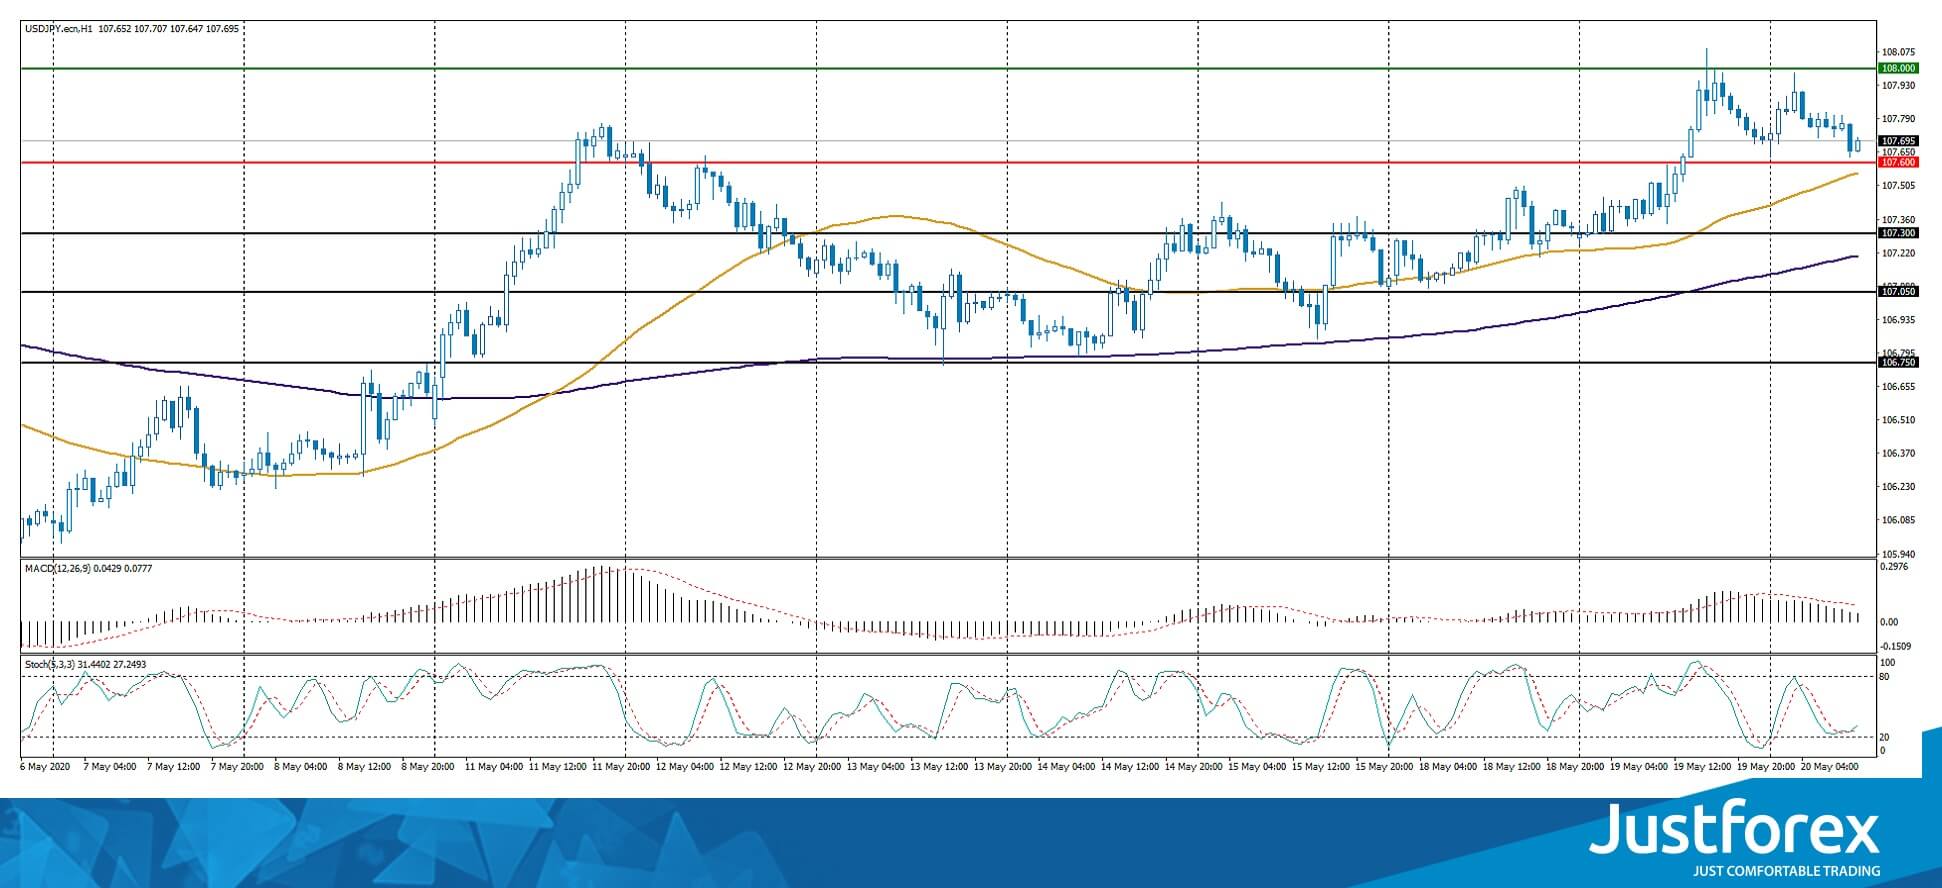
Indicators signal the power of buyers: the price has fixed above 50 MA and 100 MA.
The MACD histogram is in the positive zone, indicating the bullish sentiment.
Stochastic Oscillator is in the neutral zone, the %K line has crossed the %D line. There are no signals at the moment.
Trading recommendations
Support levels: 107.60, 107.30, 107.05
Resistance levels: 108.00, 108.40
If the price fixes above the round level of 108.00, further growth of USD/JPY quotes is expected. The movement is tending to 108.40-108.60.
An alternative could be a decrease in the USD/JPY currency pair to 107.30-107.00.


