EUR/USD
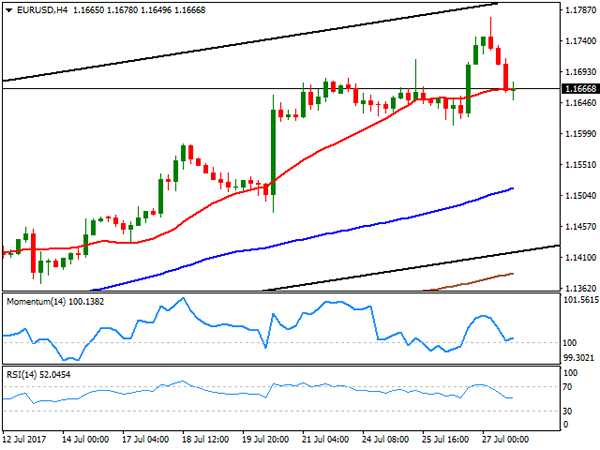
The greenback edged higher across the board, having reverted most of its post-Fed losses, with the Japanese yen being an exception to the rule. The EUR/USD pair settled at 1.1660, after trading as high as 1.1776 earlier on the day, the highest since January 2015. The corrective movement of the American currency was backed by a bounce in a dollar index after it hit a fresh 2017 low of 92.96. In the data front, however, US data came mixed, as Durable Goods Orders surged 6.5% in June, beating expectations of a 3.0% advance, mostly due to large orders in private aircraft, although the core reading, excluding transportation, came below the 0.4% expected, up by just 0.2%. In the same month, the trade deficit was of $64B, better than previous $66B, while weekly unemployment claims for the week ended July 21st resulted at 244K, up from previous’ week revised 234K.
Friday will be quite an active day in the macroeconomic front, with the release of EU July business confidence indexes, German inflation and US Q2 preliminary GDP among the most relevant figures. The US economy is expected to have grew by 1.3% in the three months to June, well below previous 1.9%, which may send the market back against the greenback.
In the meantime, the EUR/USD pair retreated after nearing the top of the ascendant channel that leads the way since mid May, holding in the upper half of it and paring losses around its 20 SMA in the 4 hours chart, while technical indicators in the mentioned time frame have corrected overbought conditions, but pared their declines around their mid-lines, from where they are currently bouncing, indicating that the intraday slide was more due to profit taking than amid selling interest.
Support levels: 1.1650 1.1615 1.1580
Resistance levels 1.1690 1.1745 1.1790
USD/JPY
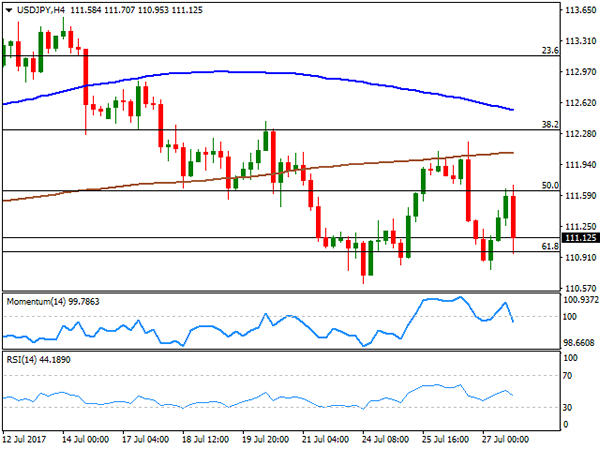
The USD/JPY pair advanced up to 111.70 mid US session, but reverse course suddenly after failing to clear a strong Fibonacci resistance, and as Wall Street plunged. There was no clear catalyst behind the late decline, but clearly, mixed US data released at the beginning of the session was not enough to fuel a rally in the pair. During the upcoming Asian session, Japan will release its June National CPI figures and Tokyo July CPI ones, forecasted to remain depressed and near its recent lows. The pair is ending the day a handful of pips above a daily of 110.77. and poised to extend its decline, given that in the 4 hours chart, technical indicators have turned sharply lower, having entered negative territory, whilst the intraday advance stalled short of its 100 and 200 SMAs, with the shortest gaining downward slope above the largest, in line with a bearish continuation for this Friday.
Support levels: 110.90 110.60 110.25
Resistance levels: 111.60 112.00 112.45
GBP/USD
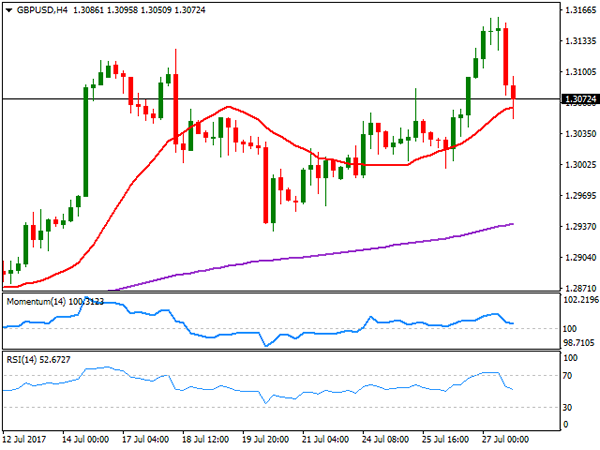
The GBP/USD pair posted a fresh yearly high of 1.3158, but ended the day in the red in the 1.3070 region, as profit taking from the latest dollar’s slump benefit the greenback in the short term. In the UK, the Confederation of British Industry released its monthly sales survey, which showed that retail sales picked up sharply in July, with the index up to 22%, well above market’s expectations of 10%. Beyond that, there were little news coming from the kingdom, with the calendar to remain light this Friday and attention shifting towards the BOE’s monetary policy meeting next week. Soft growth figures, and decelerating inflation have triggered speculation that the Central Bank will have little reasons to turn more hawkish this time, mostly anticipated to be a non-event. From a technical point of view, the downward potential remains limited according to the 4 hours chart, as the price is holding above a its 20 SMA, whilst technical indicators have eased their downward strength within positive territory, having corrected overbought conditions. The pair set a daily low of 1.3050, with a break below it favoring a deeper correction towards 1.2965.
Support levels: 1.3050 1.3010 1.2965
Resistance levels: 1.3125 1.3180 1.3230
GOLD
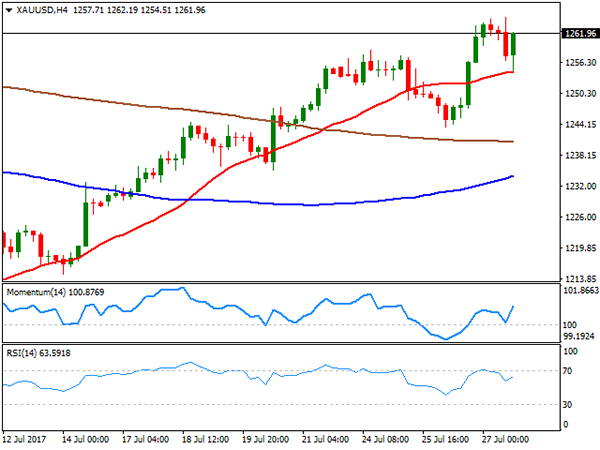
After a soft start to the day, spot gold bounced back ahead of the US close and settled at $1,262.15 a troy ounce, as plummeting equities backed demand for the safe-haven commodity. The bright metal closed the day unchanged, but posted a higher high and a higher low daily basis, maintaining the risk towards the upside. Additionally, spot reached a fresh 6-week high of 1,265.21, another factor supporting the case of a bullish continuation. In the daily chart, technical indicators have eased modestly, but hold near overbought readings, whilst the price held above all of its moving averages. In the 4 hours chart, the price met buying interest on a test of its 20 SMA, currently acting as a dynamic support at 1,254.76, while the Momentum indicator holds directionless well above its 100 level, and the RSI heads modestly lower around 61, posing a limited downward risk.
Support levels: 1,254.75 1,245.20 1,236.30
Resistance levels: 1,266.60 1,274.10 1,283.30
WTI CRUDE OIL
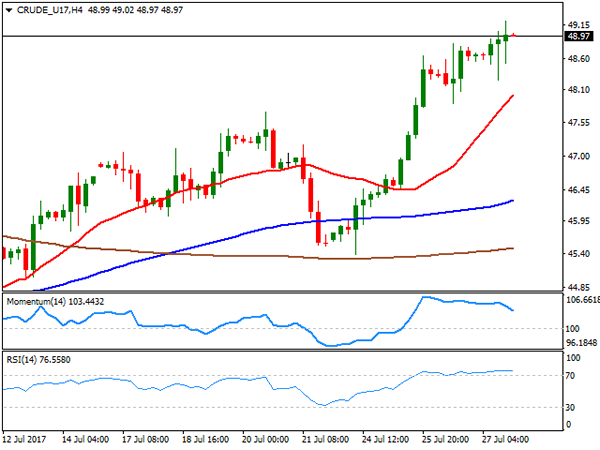
West Texas Intermediate crude futures closed at $48.96 a barrel, the highest since late May, reverting an early slide towards the 48.00 level. The early decline could be attributed to dollar’s short-term recovery, while the later bounce came amid speculative interest buying back crude, encouraged by latest positive market data. The daily chart shows that WTI advanced for a fourth consecutive day and remains biased higher, albeit in the daily chart, technical indicators are giving some first signs of exhaustion, easing near overbought levels. Still the price remains well above its 100 DMA, while the 20 DMA extended its advance below the larger. In the 4 hours chart, technical indicators are also easing modestly, still in overbought readings, whilst a sharply bullish 20 SMA below the current level and above the largest ones, indicates that the upside remains favored by market’s sentiment.
Support levels: 48.40 47.85 47.20
Resistance levels: 49.25 49.70 50.20
DJIA
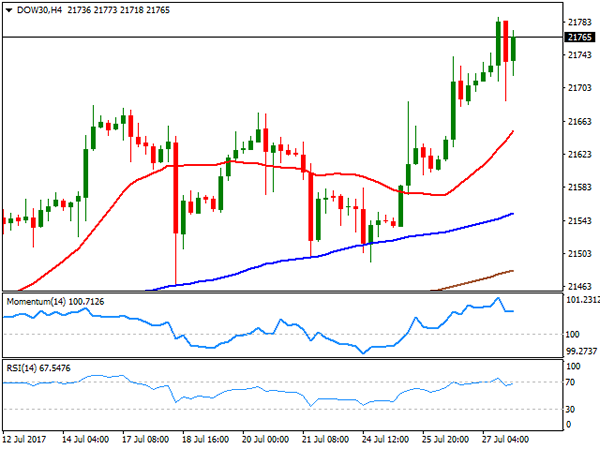
US indexes closed mixed with the Dow Jones Industrial Average settling at fresh record highs of 21,796.55, up 85 points or 0.39%, but the Nasdaq Composite shed 40 points, to 6,382.19, whilst the S&P closed 2 points lower, at 2,475.42. The index plummeted mid US session but resurged ahead of the close, weighed by a slump within tech equities. Within the Dow, Verizon led advancers, adding 7.41%, followed by Merck that closed 3.35% higher. Apple, on the other hand, was the worst performer, down 2.09%, followed by American Express that shed 1.91%. Up for a third consecutive day the index presents a strong upward momentum in the daily chart, as technical indicators extend their advances within positive territory, whilst the benchmark is further above bullish moving averages. In the shorter term, and according to the 4 hours chart, the risk is also towards the upside, as technical indicators resume their advances after a modest downward correction from overbought levels, whilst the 20 SMA accelerated its advance below the current level.
Support levels: 21,785 21,741 21,679
Resistance levels: 21,830 21,865 21,900
FTSE100
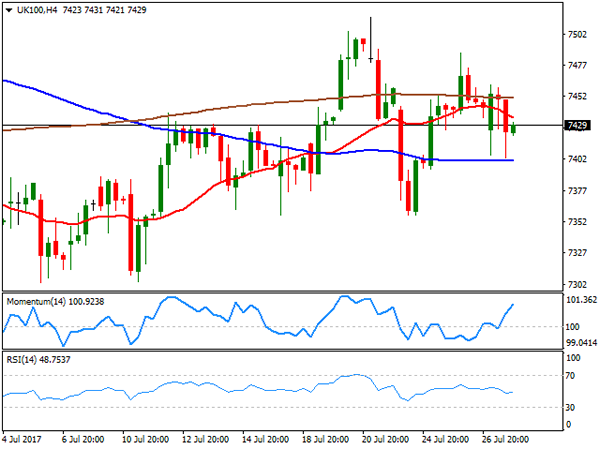
The FTSE 100 shed 9 points and closed the day at 7,443.01, following the lead of its continental counterparts. AstraZeneca was the worst performer, down 15.41% after a disappointing cancer-drug trial, followed by Provident Financial and Lloyds Banking Group, both down over 2%. Diageo was the best performer, up 5.98%, followed by Rentokil Initial that added 5.82$. Additionally, a stronger Pound at the beginning of the day dented investors’ mood. Technically, the index remains above its 20 and 100 SMAs, but posted a lower low and a lower high daily basis, whilst technical indicators turned modestly lower, nearing their mid-lines from above, leaning the scale towards the downside, albeit not enough to confirm further slides. In the 4 hours chart, the index remains stuck between directionless moving averages, whilst the Momentum indicator aims higher within positive territory as the RSI indicator remains stuck around its 50 level, indicating absence of clear directional strength.
Support levels: 7,485 7,435 7,390
Resistance levels: 7,482 7,518 7,561
DAX
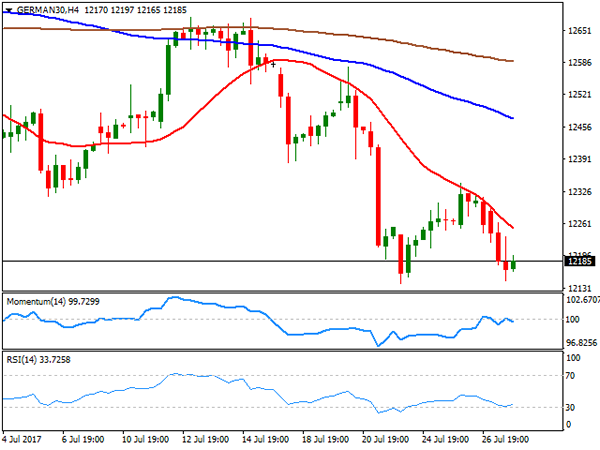
The German DAX closed at 12,212.04, down 92 points or 0.76%, as pharmaceutical and financial equities weighed down European indexes. In the news, the German GFK consumer confidence survey surged to a record high of 10.8 from 10.6 in the previous month, in line with the IFO reading seen earlier this month, indicating strong business confidence in the leading European country. Deutsche Bank was the worst performer, ending the day 4.92%, followed by Bayer that shed 3.07%. Allianz, on the other hand, led the advance with a 1.76% gain, followed by Vonovia that added 1.57%. In the daily chart, the technical bias is towards the downside, with the index further below its 20 and 100 SMAs and technical indicators extending their slides within negative territory. In the 4 hours chart, the downside is also favored, given that the index remained contained by a bearish 20 SMA, currently at 12,251, whilst the Momentum indicator turned lower around its 100 level, and the RSI indicator barely bounced from oversold levels.
Support levels: 12,146 12,098 12,053
Resistance levels: 12,251 12,303 12,354