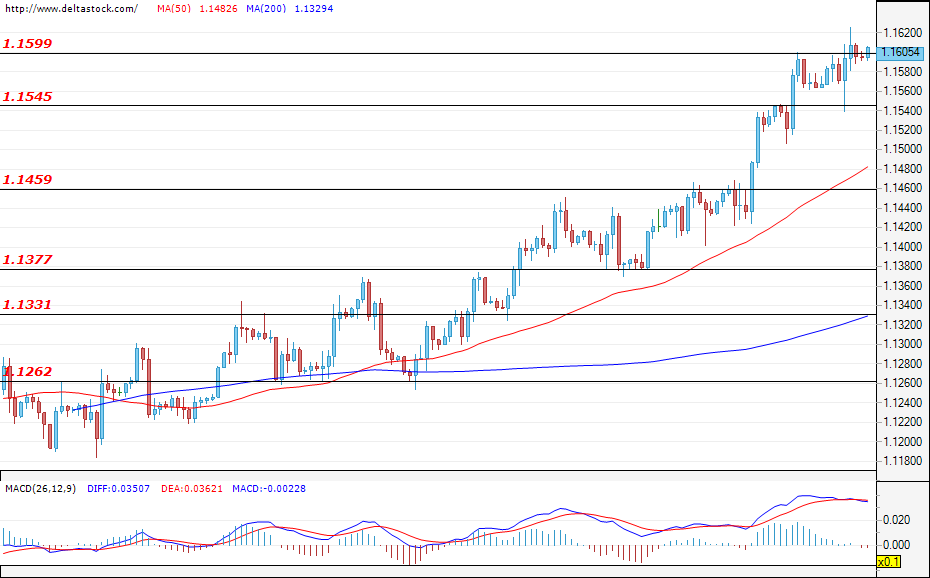
EUR/USD
Current level – 1.1605
The bullish expectations are still intact and yesterday the EUR/USD tested the important resistance level at 1.1600. The price consolidated over the aforementioned zone and further positive move is highly probable. Successful confirmation of the breach here could easily lead the currency pair towards the highs around the levels at 1.1750 and possibly 1.1930 in the longer term. If the power of the bulls is not enough, a negative push could lead to a test of the first support zone at 1.1545 or a deeper correction and test of the next target at 1.1459, if 1.1545 does not hold.
| Resistance | Support | ||
| intraday | intraweek | intraday | intraweek |
| 1.1600 | 1.1810 | 1.1545 | 1.1370 |
| 1.1700 | 1.1930 | 1.1460 | 1.1230 |
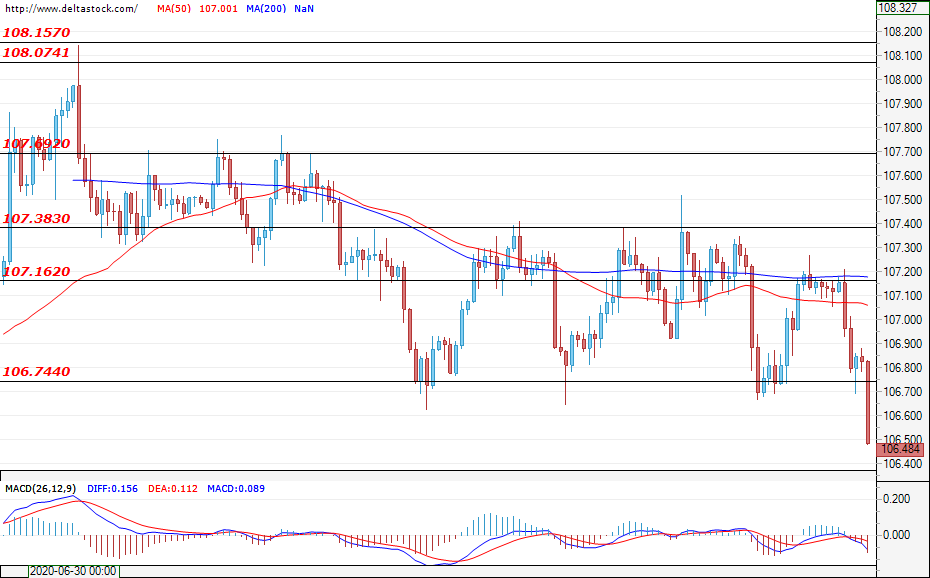
USD/JPY
Current level – 106.48
The bears took control after the start of trading today. The USD/JPY lost some ground and breached the support zone and lower border of the channel at 106.74. An increase in bearish momentum and a successful break of the next support zone at 106.55 could deepen the sell-off and lead the currency pair towards the lows from May, around 106.00. In a positive scenario, the first minor resistance lies at 107.19, but only a break through the next target for the bulls at 107.20 could lead to a change of the current market sentiment.
| Resistance | Support | ||
| intraday | intraweek | intraday | intraweek |
| 106.74 | 107.38 | 106.50 | 106.50 |
| 107.16 | 107.69 | 106.00 | 106.00 |
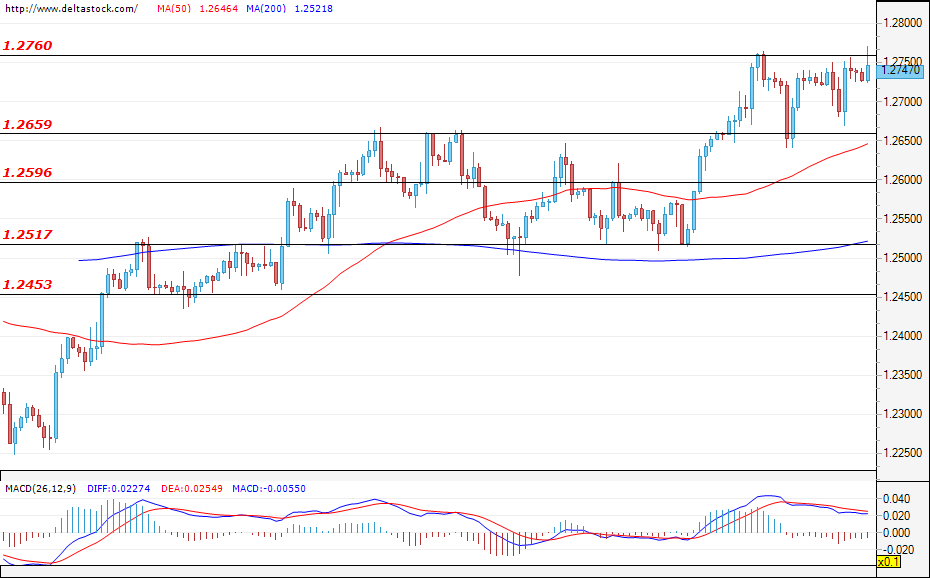
GBP/USD
Current level – 1.2747
The Cable continues to trade just below the resistance zone at 1.2760. A test of this level is highly probable as the dollar is losing ground against the major currencies. A successful break of this level could easily lead to new gains for the GBP and pave the way towards 1.2874. If the aforementioned resistance holds, the more likely scenario will be a dip towards the first support level that lies 1.2659, but should be limited to 1.2596, if the selling pressure increases.
| Resistance | Support | ||
| intraday | intraweek | intraday | intraweek |
| 1.2760 | 1.2860 | 1.2660 | 1.2520 |
| 1.2800 | 1.2975 | 1.2600 | 1.2310 |