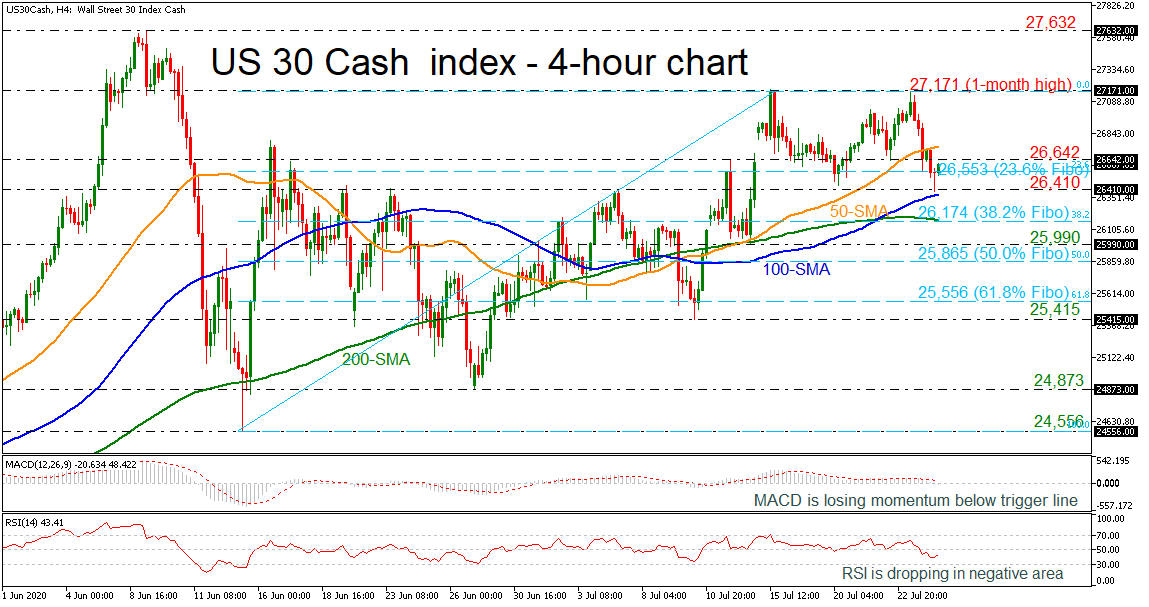
The US 30 cash index is tumbling over the last couple of sessions in the 4-hour chart, penetrating the 50-period simple moving average (SMA) and moving towards the 100-period SMA. From the technical viewpoint, the RSI is falling beneath the neutral threshold of 50, while the MACD is losing momentum below its trigger line.
More losses could take the index towards the 38.2% Fibonacci retracement level of the up leg from 24,556 to 27,171 at 26,174, which overlaps with the 200-period SMA. Beneath the latter, the market could open the door for the 25,990 area ahead of the 50.0% Fibonacci of 25,865 and the 61.8% Fibonacci of 25,556.
Alternatively, an increase beyond the 23.6% Fibo of 26,553 and the 26,642 resistance, could test the 50-period SMA at 26,727. Even higher, the one-month high of 27,171 would come in the spotlight before leading the price for more bullish actions until 27,632, registered on June 9.
In brief, the US 30 index has been in an ascending tendency over the last six weeks, however, a decline below the 26,410 support, could confirm a double top pattern around 27,171 and switch the market to bearish.