
The EUR/USD currency pair
Technical indicators of the currency pair:
Prev Open: 1.18364
Open: 1.18595
% chg. over the last day: +0.19
Day’s range: 1.18393 – 1.18826
52 wk range: 1.0637 – 1.1967
There is an ambiguous technical pattern on the EUR/USD currency pair. At the moment, quotes are consolidating. Investors expect additional drivers. The greenback demand has weakened slightly amid rising jobless claims and declining US treasury yields. ECB representatives do not exclude that the Eurozone economy will need additional financial stimulus this autumn. Currently, the local support and resistance levels are 1.1845 and 1.1885, respectively. The trading instrument is tending to decline. Positions should be opened from key levels.
The news feed on 2020.08.21:
A number of indicators on economic activity in Germany and the Eurozone at 10:30 (GMT+3:00) and 11:00 (GMT+3:00);
Existing home sales in the US at 17:00 (GMT+3:00).
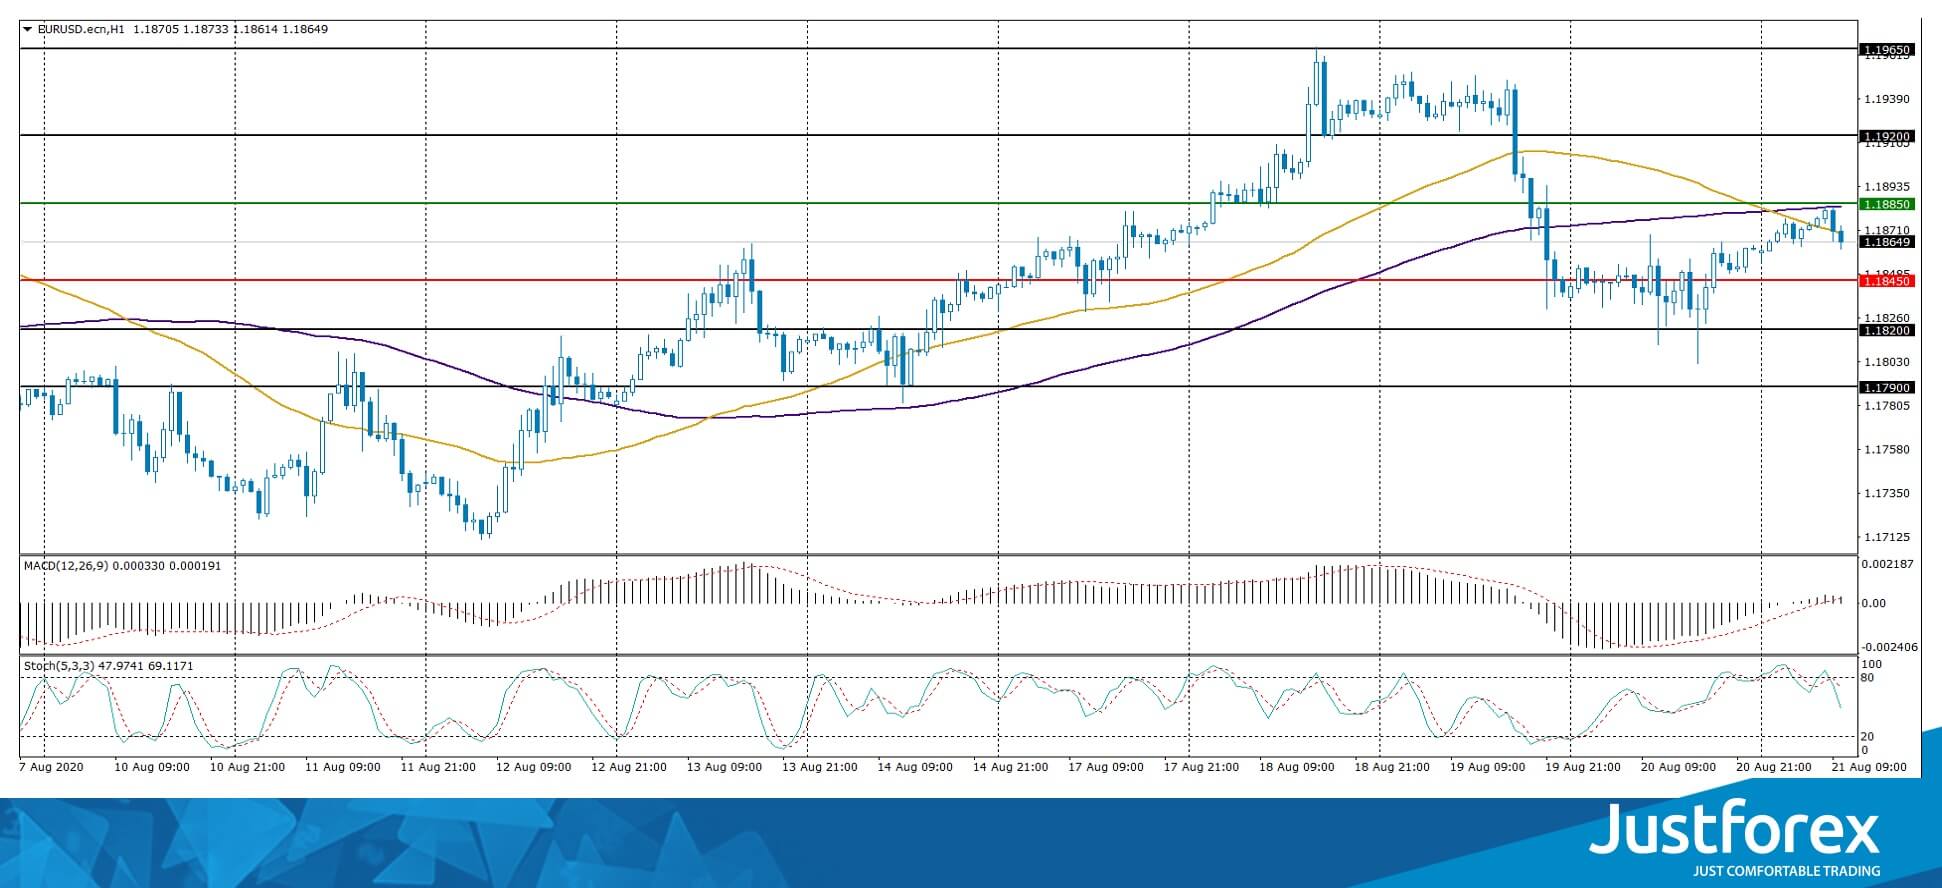
Indicators do not give accurate signals: the price has crossed the 50 MA and 100 MA.
The MACD histogram is near the 0 mark.
Stochastic Oscillator is in the neutral zone, the %K line is below the %D line, which indicates the bearish sentiment.
Trading recommendations
Support levels: 1.1845, 1.1820, 1.1790
Resistance levels: 1.1885, 1.1920, 1.1965
If the price fixes below 1.1845, EUR/USD quotes are expected to fall. The movement is tending to 1.1800-1.1780.
An alternative could be the growth of the EUR/USD currency pair to 1.1920-1.1950.
The GBP/USD currency pair
Technical indicators of the currency pair:
Prev Open: 1.30896
Open: 1.32143
% chg. over the last day: +0.87
Day’s range: 1.32055 – 1.32550
52 wk range: 1.1409 – 1.3516
In the last sessions, trades on the GBP/USD currency pair are very active. At the same time, there is no defined trend. At the moment, the local support and resistance levels are 1.3210 and 1.3260, respectively. Today, investors will assess the statistics on economic activity in the UK. Positions should be opened from key levels.
At 11:30 (GMT+3:00), a number of indicators on economic activity will be published in the UK.
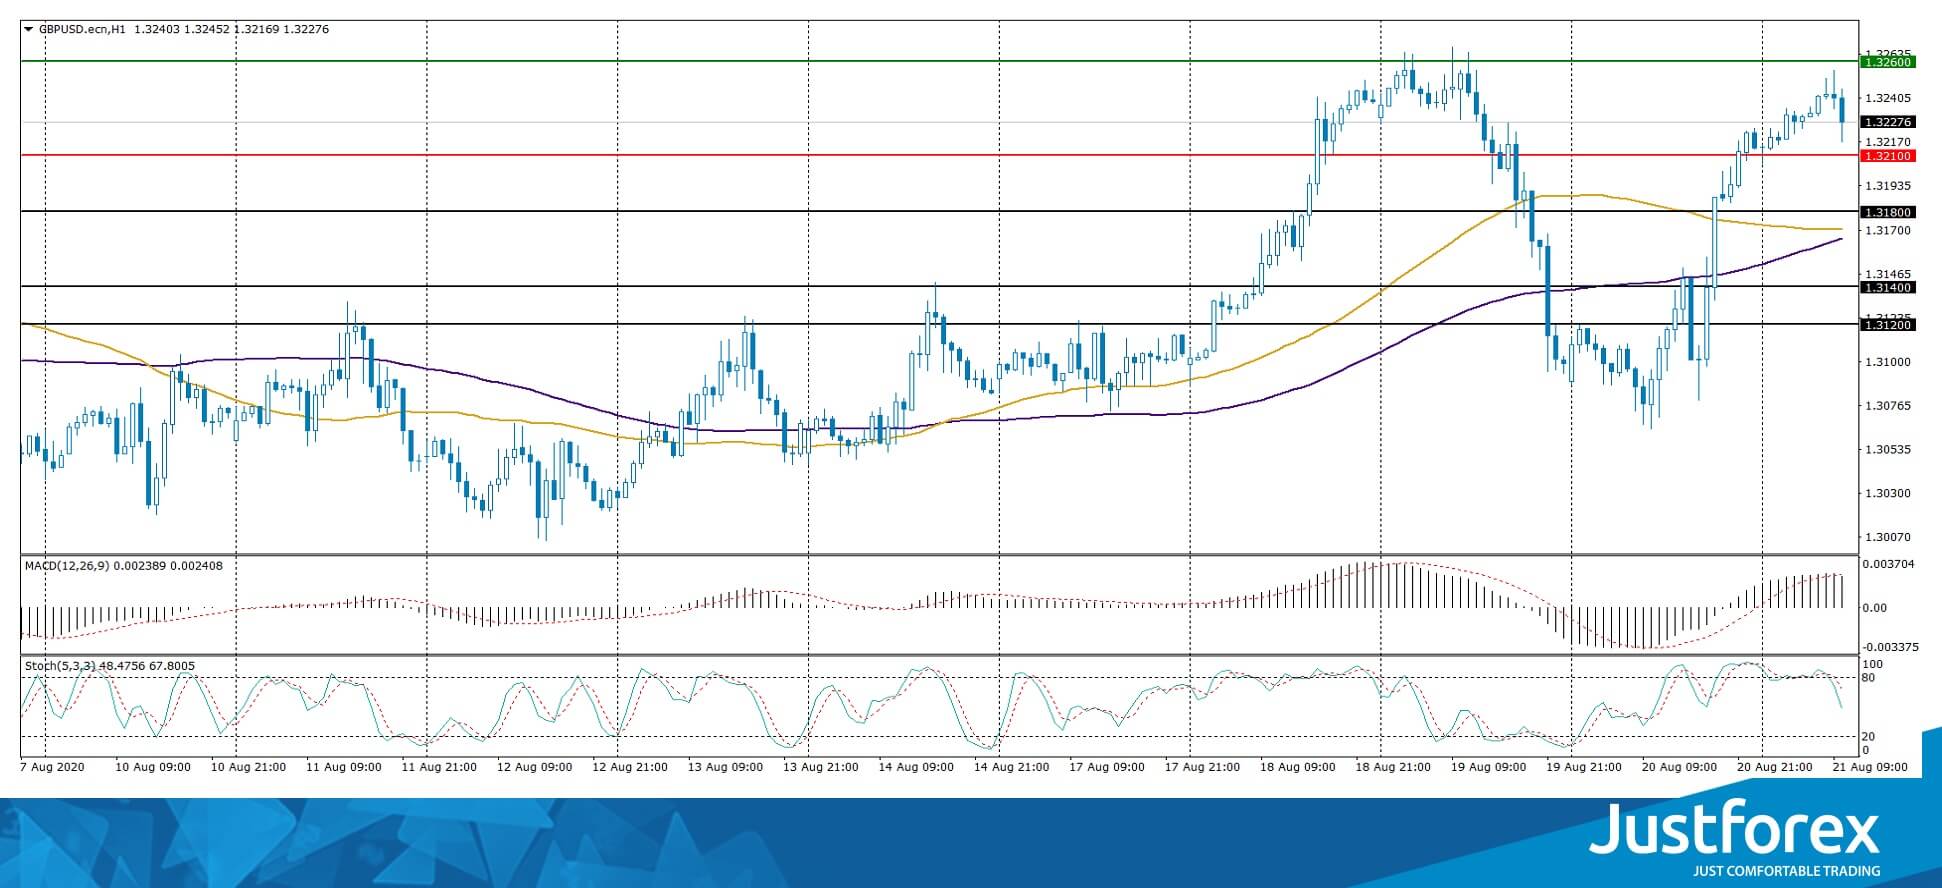
Indicators signal the power of buyers: the price has fixed above 50 MA and 100 MA.
The MACD histogram is in the positive zone, which indicates the bullish sentiment.
Stochastic Oscillator is in the neutral zone, the %K line is below the %D line, which gives a signal to sell GBP/USD.
Trading recommendations
Support levels: 1.3210, 1.3180, 1.3140
Resistance levels: 1.3260, 1.3300
If the price fixes below 1.3210, GBP/USD quotes are expected to fall. The movement is tending to 1.3170-1.3140.
An alternative could be the growth of the GBP/USD currency pair to the round level of 1.3300.
The USD/CAD currency pair
Technical indicators of the currency pair:
Prev Open: 1.32138
Open: 1.31895
% chg. over the last day: -0.23
Day’s range: 1.31591 – 1.31895
52 wk range: 1.2949 – 1.4669
There is an ambiguous technical pattern on the USD/CAD currency pair. The trading instrument is consolidating. At the moment, the local support and resistance levels are 1.3160 and 1.3200, respectively. Financial market participants expect important economic releases from the US and Canada. We also recommend paying attention to the dynamics of oil quotes. Positions should be opened from key levels.
At 15:30 (GMT+3:00), a report on retail sales will be published in Canada.
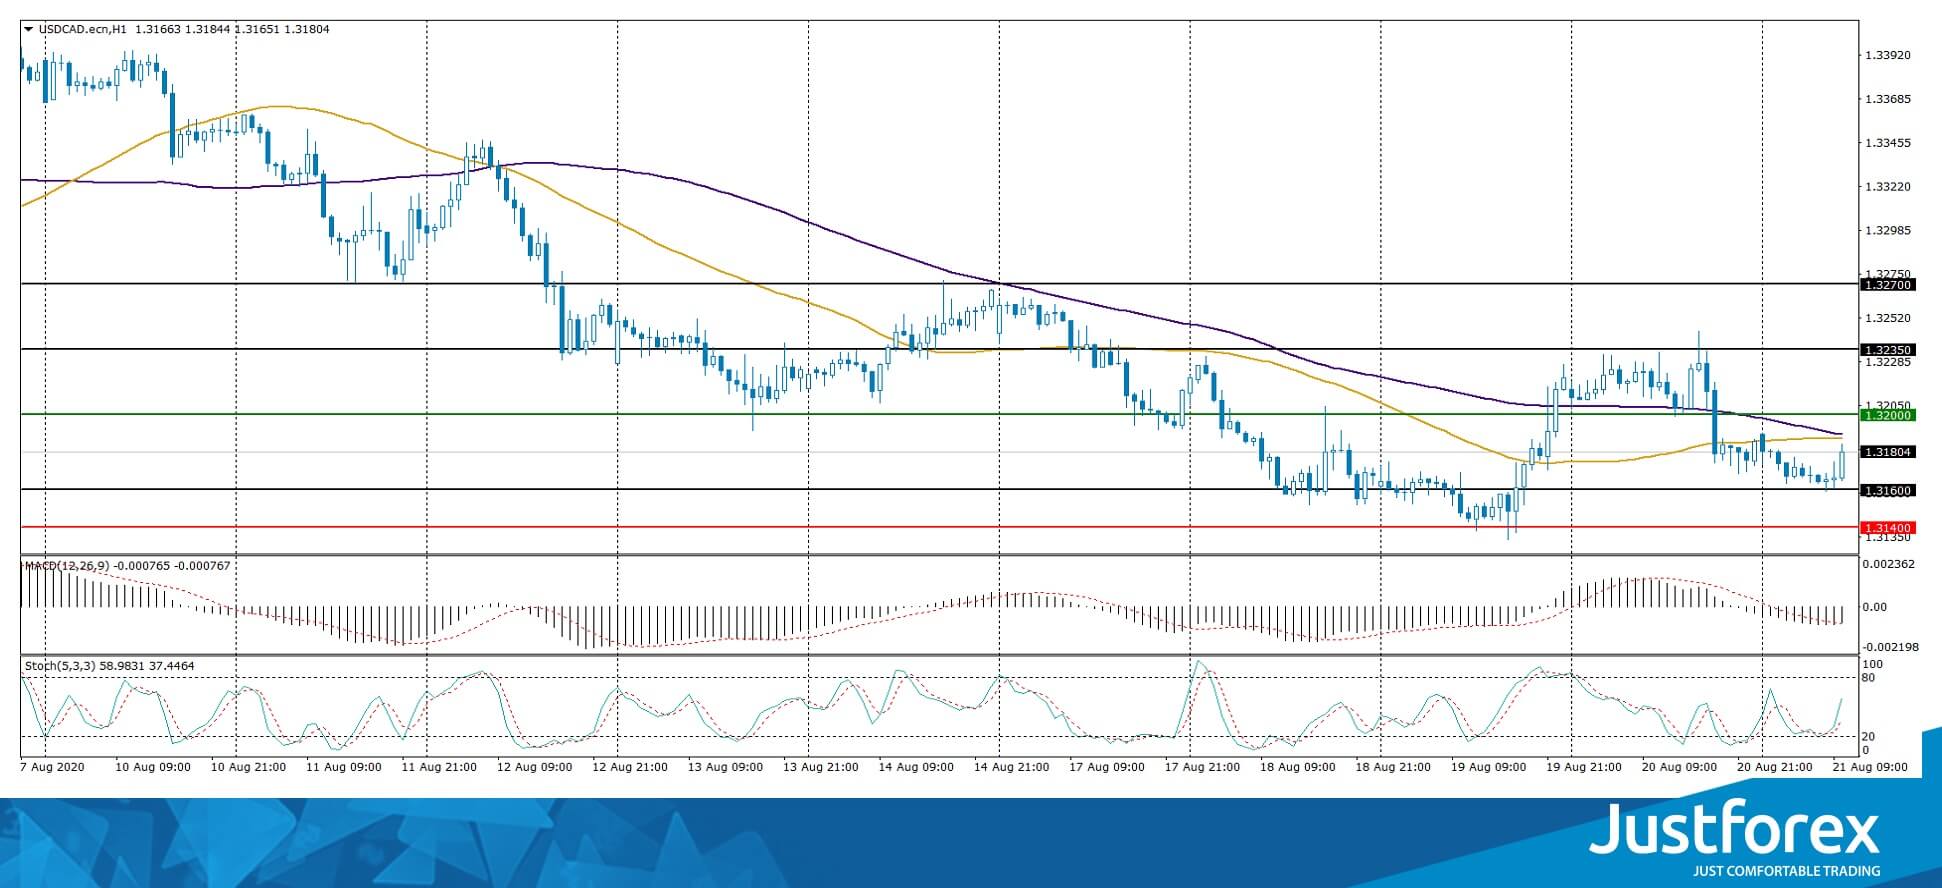
Indicators do not give accurate signals: the price has crossed the 50 MA and 100 MA.
The MACD histogram is in the negative zone, which indicates the bearish sentiment.
Stochastic Oscillator is in the neutral zone, the %K line is above the %D line, which gives a signal to buy USD/CAD.
Trading recommendations
Support levels: 1.3160, 1.3140, 1.3100
Resistance levels: 1.3200, 1.3235, 1.3270
If the price fixes above 1.3200, USD/CAD purchases should be considered. The movement is tending to 1.3240-1.3270.
An alternative could be a decline of the USD/CAD currency pair to the round level of 1.3100.
The USD/JPY currency pair
Technical indicators of the currency pair:
Prev Open: 106.112
Open: 105.776
% chg. over the last day: -0.29
Day’s range: 105.441 – 105.795
52 wk range: 101.19 – 112.41
There are sales on the USD/JPY currency pair. The trading instrument has updated local lows. At the moment, USD/JPY quotes are testing the support level of 105.40. The level of 105.75 is the nearest resistance. Investors expect additional drivers. We recommend paying attention to the dynamics of US government bonds yield. Positions should be opened from key levels.
We expect important economic releases from the US.
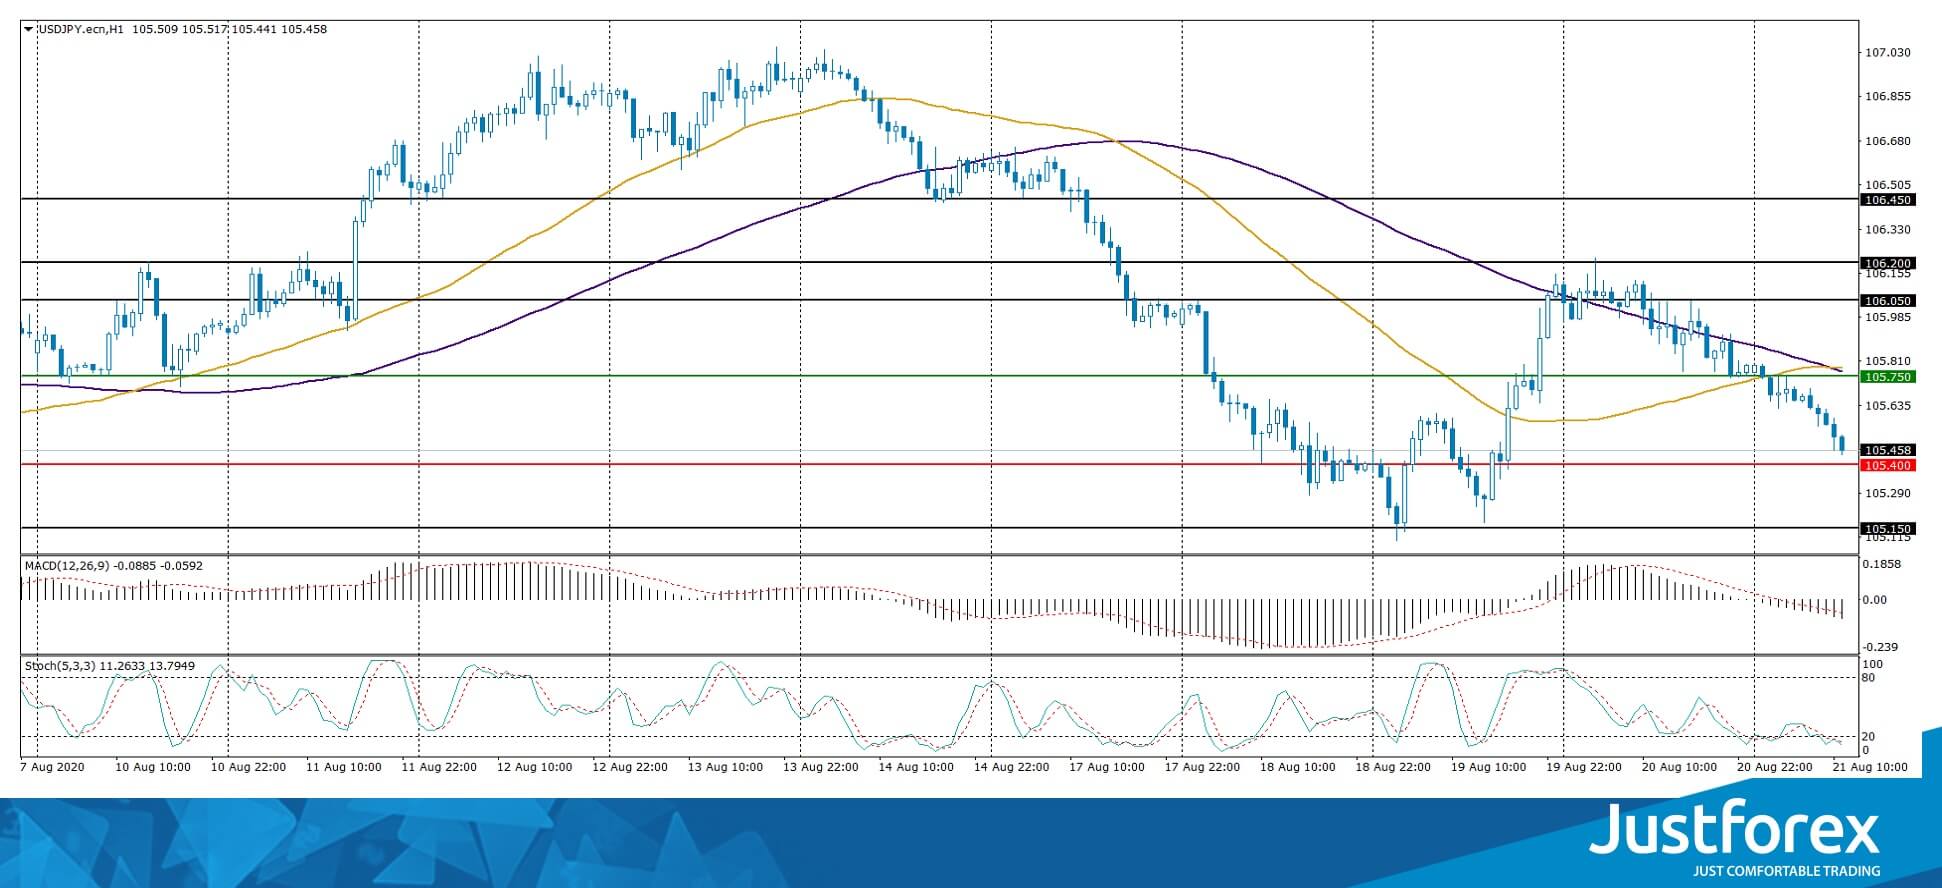
Indicators do not give accurate signals: 50 MA has crossed 100 MA.
The MACD histogram is in the negative zone, which indicates the bearish sentiment.
Stochastic Oscillator is in the oversold zone, the %K line has crossed the %D line. There are no signals at the moment.
Trading recommendations
Support levels: 105.40, 105.15, 105.00
Resistance levels: 105.75, 106.05, 106.20
If the price fixes below 105.40, USD/JPY quotes are expected to fall. The movement is tending to the round level of 105.00.
An alternative could be the growth of the USD/JPY currency pair to 106.00-106.20.


