EUR/USD
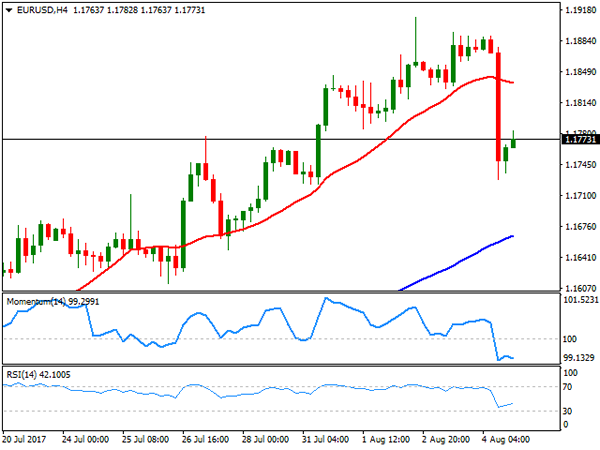
The American dollar saw a dramatic change of course on Friday, following the release of the US Nonfarm Payroll report, resulting in the EUR/USD pair trimming all of its weekly gains to end it flat around 1.1773. According to official figures, the US added 209,000 new jobs in July, beating expectations of around 180K, while June figure was revised higher by 2,000. The unemployment rate fell to 4.3% as expected, while average hourly earnings were up 2.5% on an annualized basis matching June’s figure and above the expected 2.4%. Average hourly earnings rose by 0.3% when compared to the previous month, matching market’s forecast.
Overall positive and supportive of Fed’s tightening policy, the report was not as good as market’s reaction suggests, particularly as wages’ growth remains shallow, insufficient to push inflation higher. The data helped investors taking profits out of the table, as the EUR/USD pair rallied for four consecutive weeks reaching a fresh 2017 high of 1.1909. The corrective movement could extend, yet it still too early to describe the greenback as "bullish," as unless inflation clearly picks up, investors will be unwilling to buy the dollar, also dented by political jitters. The other factor of the equation is the latest EUR self-strength, backed by solid growth data and speculation that the ECB will make an announcement on tapering as soon as next September.
From a technical point of view, readings in the daily chart support a corrective movement, as technical indicators have turned sharply lower from extreme overbought levels, but remain far above their mid-lines, whilst the price remains above all of its moving averages that maintain their upward slopes. The 20 DMA is the closest, currently around 1.1660. In the 4 hours chart, the price broke below its 20 SMA, which is not flat in the 1.1860 region, while technical indicators pared their declines, but remain near, oversold readings. The key support for this Monday is 1.1715, 2015 high and the level to break to confirm a steeper decline over the next few sessions.
Support levels: 1.1750 1.1715 1.1680
Resistance levels: 1.1785 1.1820 1.1860
USD/JPY
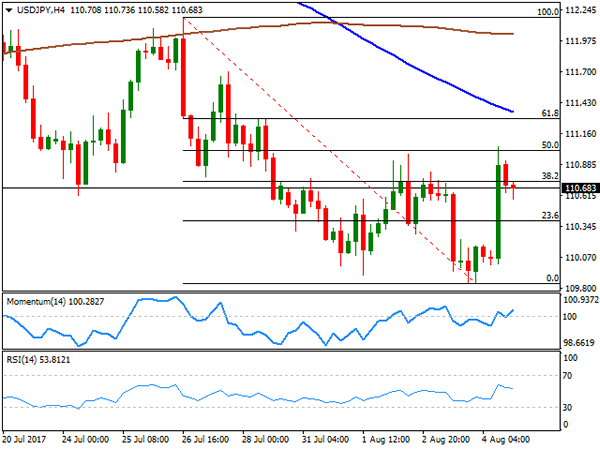
The USD/JPY pair ended the week at 110.68, barely 15 pips above Monday’s opening, and after extending its recent decline down to 109.84, its lowest since mid June. On Friday, the pair surged up to 111.04, as an upbeat US employment report helped the greenback correcting higher after being under pressure for three consecutive weeks, with speculative interest using employment data as an excuse to take profits out before deciding what’s next. The Japanese yen appreciated earlier in the week, as bond yields trended lower, holding near their yearly lows. The strong jobs’ reported helped them bounce, but not enough to close the week in positive territory, therefore limiting yen´s losses. At the beginning of the week, Japan will release its preliminary June Coincident and Leading economic indexes, key measures of the current and future economic activity. From a technical perspective, the daily chart shows that the price settled below its 100 and 200 SMAs, whilst indicators bounced from oversold readings, but remain well into negative territory, limiting chances of further recoveries. Additionally, the 4 hours chart shows that the pair closed below the 38.2% retracement of its latest bearish run between 112.18 and the mentioned low at 110.70, retracing from the 50% retracement of the same decline around 111.05. In this last time frame, the 100 SMA maintains a strong bearish slope well above the level, while technical indicators hover around their mid-lines unable to provide directional clues.
Support levels: 110.35 109.85 109.50
Resistance levels: 110.70 111.05 111.40
GBP/USD
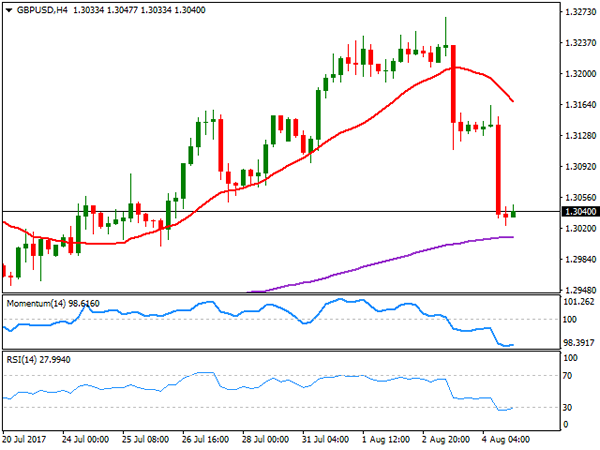
The British Pound was among the worst performers last week, taking a double hit, one from the BOE and the other by the better-than-expected US jobs report. The GBP/USD pair plunged for a second consecutive day to end at 1.3040, its lowest in almost two weeks. The Bank of England decided last Thursday to maintain its monetary policy unchanged, but policy makers estimate that they would need to raise rates two times over the next three years, up from previous forecast of one, but downgraded their growth estimates for this year and the next. The MPC also warned about the uncertainty surrounding Brexit, saying that it could increase inflationary pressures. However, the market took the statement as dovish, particularly as recent data showing sluggish grown and weak wage growth resulted in six out of the eight MPC members voting to keep their policy unchanged. The pair is close to a bearish breakout according to the daily chart, as it settled below its 20 DMA, while technical indicators turned south and are about to enter negative territory. The key is the 1.3000 threshold as a break below it will likely dent further investors’ sentiment. In the 4 hours chart, the 20 SMA turned sharply lower above the current level, while technical indicators ended the week flat in oversold territory, with no signs of changing course. The 200 EMA in this last time frame stands around 1.3000, reinforcing the psychological support level.
Support levels: 1.3000 1.2965 1.2920
Resistance levels: 1.3070 1.3110 1.3150
GOLD
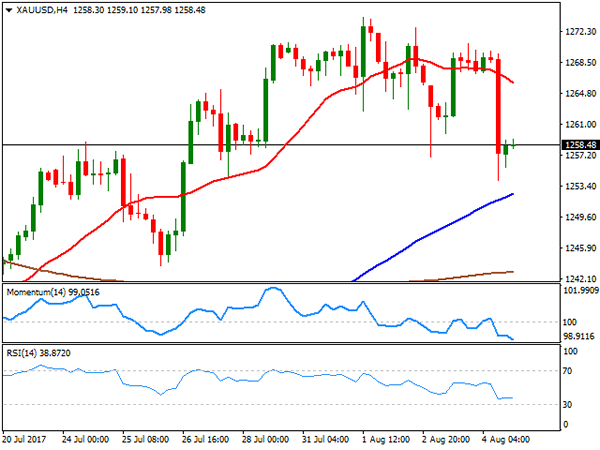
Gold prices plunged on Friday to close the week in the red, with spot settling at $1,258.49 a troy ounce, on a resurging dollar following the release of the US monthly employment report that supports Fed’s case of normalization. The commodity retreated from a seven-week high of 1,274.04, and while the slide has been quite impressive on Friday, a bearish continuation is not yet clear, moreover considering that other US economic indicators released through the week signaled sluggish economic conditions at the beginning of the third quarter. Technically, the daily chart shows that the price held above its 100 DMA, now the immediate support around 1.254.10, while the 20 DMA maintains its bullish slope, not far below the largest. Indicators in the mentioned chart have turned sharply lower from overbought levels, but remain within positive territory, indicating that the downward move may extend on a break below the mentioned dynamic support. In the 4 hours chart, and for the short term, the risk turned towards the downside, as the price is currently developing below a strongly bearish 20 SMA, while the Momentum indicator heads south within negative territory and at fresh 1-month low, while the RSI indicator consolidates around 38.
Support levels: 1,254.10 1,245.20 1,235.20
Resistance levels: 1,265.30 1,274.05 1,283.30
WTI CRUDE OIL
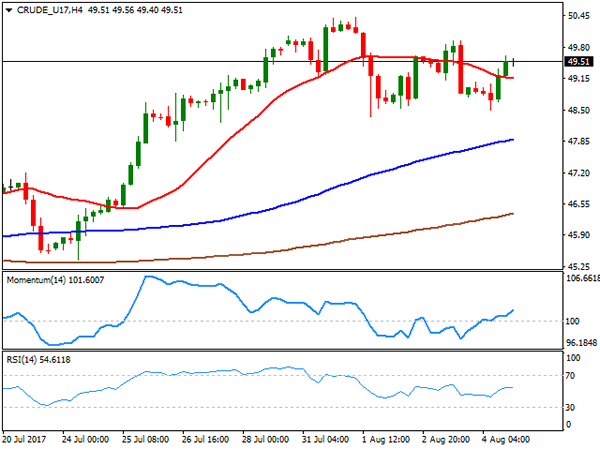
West Texas Intermediate crude futures closed the week marginally lower at $49.51 a barrel after failing to regain the 50.00 level earlier on the week .The commodity came under pressure earlier on the week on news that African OPEC’s members rose their oil output during July, while the American Petroleum Institute reported an inventory build of 1.779 million barrels, well above an almost 3 million decline. The EIA report showed a smaller-than-expected draw of 1.5 million barrels. Friday’s bounce was backed by the Baker Hughes report, as the number of active rigs drilling oil in the US fell by one to 765. In the daily chart, the upside is being contained by a horizontal 200 DMA, currently around 50.00, while the Momentum indicator retreated from oversold readings and heads lower within positive territory, but the RSI remains firm around 61, whist the 20 DMA advances above the 100 DMA below the current price, limiting the downside potential. In the 4 hours chart, the technical outlook is modestly bullish, as the price settled above a flat 20 SMA while the RSI indicator consolidates around 54, and the Momentum aims higher above its 100 level.
Support levels: 48.80 48.30 47.70
Resistance levels: 50.20 50.85 51.40
DJIA
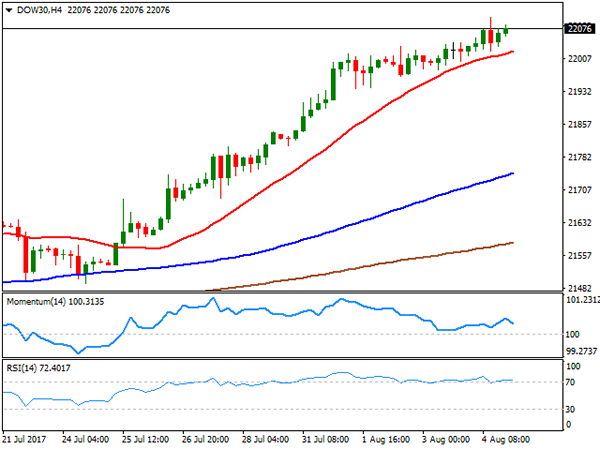
Wall Street closed in the green, with the Dow Jones Industrial Average posting its eighth consecutive record close, up 66 points to 22,092.81. The Nasdaq Composite gained 0.18% or 11 points to 6,351.56, while the S&P added 4 points to close at 2,476.83. Indexes were boosted by the solid employment report released on Friday, and despite escalating political tensions related to Russia’s involvement in the US election. Financial-related equities led the way higher within the Dow, following their European counterparts, with Goldman Sachs up 2.59% being the best performer, followed by Home Depot that added 1.30% and JP Morgan that closed 1.25% higher. Walt Disney was the worst performer, down 1.31%, followed by Merck that shed 0.66%. From a technical point of view, the upside remains favored in the DJIA, as the index remains well above bullish moving averages, whilst technical indicators have barely decelerated their advance, still holding within extreme overbought territory. In the 4 hours chart, a bullish 20 SMA keeps providing short term support, currently at 22,023, the Momentum indicator heads south within positive territory, while the RSI indicator remains flat in overbought territory, reflecting the latest consolidation rather than suggesting upward exhaustion.
Support levels: 22,023 21,982 21,940
Resistance levels: 22,102 22,145 22,190
FTSE100
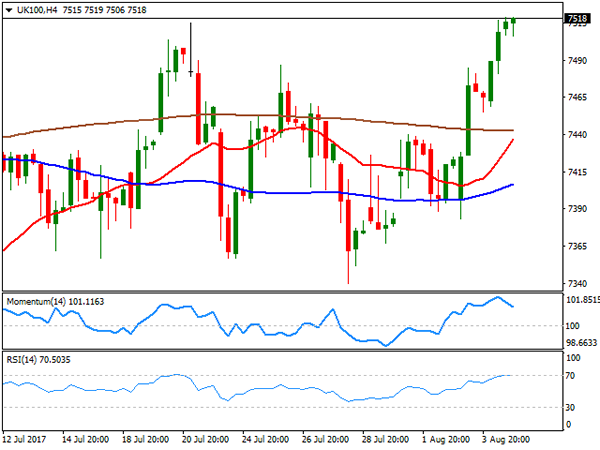
The FTSE 100 closed the week higher at 7,511.71, strongly up for a second consecutive day. The benchmark added 37 points on Friday as the Pound kept easing, although soften within mining and home builders’ equities limited the advance. Barratt Developments was the worst performer, down 4.69%, followed by Persimmon that shed 3.98%. Randgold Resources led the way lower from commodity-linked equities shedding 1.87%. Leading the way higher was Merlin Entertainments up 5.75%, followed by Mediclinic that added 4.06%. The index settled at its highest for the week, and the daily chart supports additional gains ahead, as the index has finally detached from its 20 and 100 DMAs, with the shortest gaining upward traction, whilst technical indicators head north well above their mid-lines. In the 4 hours chart, technical indicators eased modestly within overbought territory, but the index remains well above all of its moving averages, in line with further gains ahead.
Support levels: 7,487 7,440 7,392
Resistance levels: 7,540 7,572 7,600
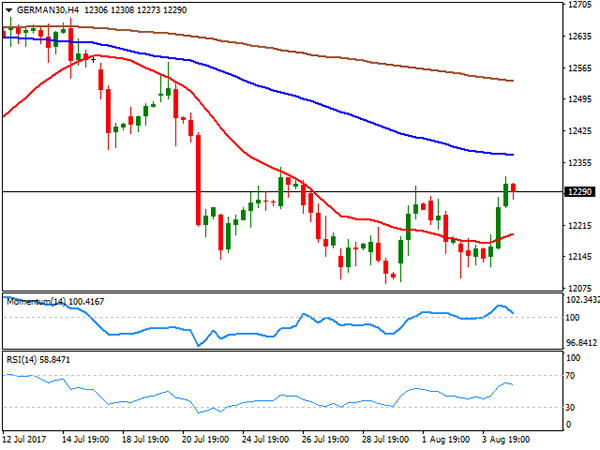
DAX
A weakening EUR underpinned European equities which closed firmly higher on the last trading day of the week. The German DAX added 114 points or 1.18%, to end at 12,297.70, boosted by an advance in financial and industrial-related equities. Macroeconomic news coming from Germany showed that in June, factory orders rose by more than expected, up by 1.0% in the month and by 5.1% from a year earlier, largely surpassing market’s expectations. Within the DAX, only two members closed lower, Siemens that shed 0.71% and Merck that lost 0.47%. Leading advancers was E.ON, up 3.95%, followed by Commerzbank which added 3.53%. The index closed near its highest for the week, but in the daily chart, the upward potential remains limited, given that it stalled below a bearish 20 DMA that extended its slide below the 100 DMA, while technical indicators have managed to bounce from oversold levels, but remain within negative territory. In the 4 hours chart, the index settled above a modestly bullish 20 SMA, while technical indicators lost their upward strength and turned lower after entering positive territory, in line with the longer term perspective.
Support levels: 12,255 12,210 12,174
Resistance levels: 12,323 12,381 12,427